
Understand TOTAL2 to observe the structure of the altcoin market and gain a better understanding of the altseason cycle. In this article, we will take a deeper look at what TOTAL2 is, its mechanism, how to read it, its correlation with altseason, and the best timing to analyze it.
Article Summary
- 🔎 TOTAL2: A composite index of the total crypto market capitalization excluding Bitcoin.
- 🧠 Function of TOTAL2: Helps traders analyze market cycles and identify overall altcoin patterns.
- 🚀 Correlation Between TOTAL2 and Altseason: TOTAL2 tends to rise significantly after Bitcoin halving, often followed by rallies in altcoins such as $SOL.
What Is TOTAL2?
Market capitalization (market cap) is an important indicator for assessing the overall value of an asset in the market. Traders often use this data to compare the potential of crypto assets and to determine whether an asset’s current market value is realistic, undervalued, or overvalued.
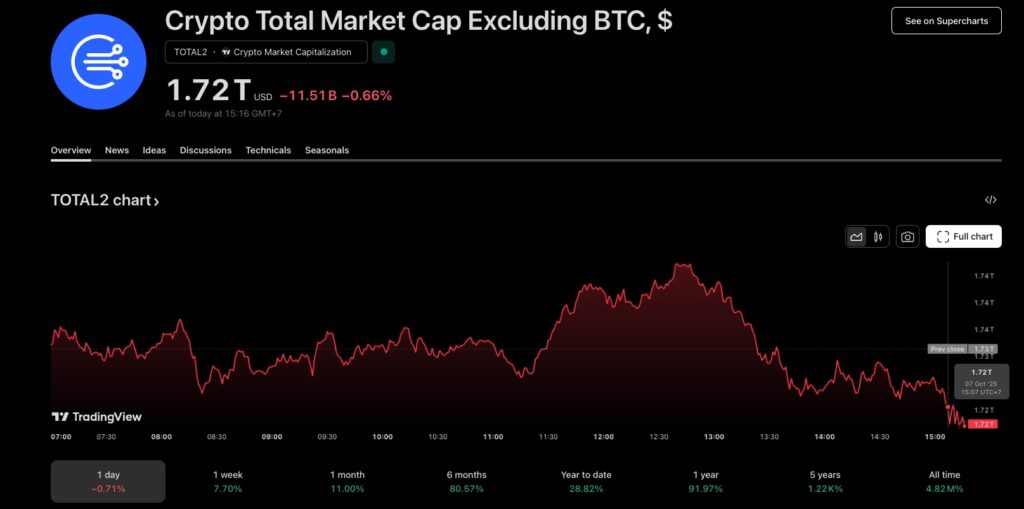
Interestingly, in the crypto market, you can view market capitalization either for the entire market or for specific groups of assets, such as altcoins alone. The indicator that shows the total market value of all altcoins excluding Bitcoin is known as TOTAL2. This data is available in chart form, accessible and analyzable for free, making it highly useful for traders to understand the structure of the altcoin market.
TOTAL2 is a composite index that represents the total market capitalization of all altcoins, excluding Bitcoin. This index is available on charting platforms such as TradingView and is commonly used to analyze market cycles as well as perform technical analysis on altcoin movements in the market.
In general, market capitalization data can be found on aggregator sites like CoinGecko or CoinMarketCap. However, these platforms only display total figures without providing visualizations of patterns or trends that can be analyzed using technical indicators.
This is where TOTAL2 becomes particularly useful. By using the TOTAL2 chart, you can identify market patterns and cycles, determine support and resistance levels, and estimate potential changes in the altcoin market direction more accurately.
There are three commonly used composite crypto market capitalization indices: TOTAL, TOTAL2, and TOTAL3. The comparison is as follows.
- TOTAL: A composite index of the overall crypto market capitalization.
- TOTAL2: A composite index of altcoin market capitalization, covering Ethereum and all other altcoins.
- TOTAL3: A composite index of the crypto market capitalization excluding Bitcoin and Ethereum.
TOTAL2 is specifically separated from Bitcoin’s market capitalization due to the significant difference in market dominance. This allows TOTAL2 to provide a clearer perspective on the overall performance of altcoins.
How Does TOTAL2 Work?
At the time this article was written, ETH remained the altcoin with the largest market capitalization, approximately USD 500 billion out of a TOTAL2 of USD 1.72 trillion. With nearly a 30% share of TOTAL2, ETH’s price movements have a significant impact on the TOTAL2 chart, although it is also influenced by the movements of other major altcoins such as BNB, SOL, and XRP.
In other words, TOTAL2 is calculated based on the market value of altcoins from their circulating supply. If an altcoin project releases previously locked supply, the increase in supply can affect the overall altcoin market capitalization, and TOTAL2 will reflect this change as a data aggregator.
Unfortunately, traders cannot directly track the specific list of altcoins included in TOTAL2.
Correlation Between TOTAL2 and Altseason
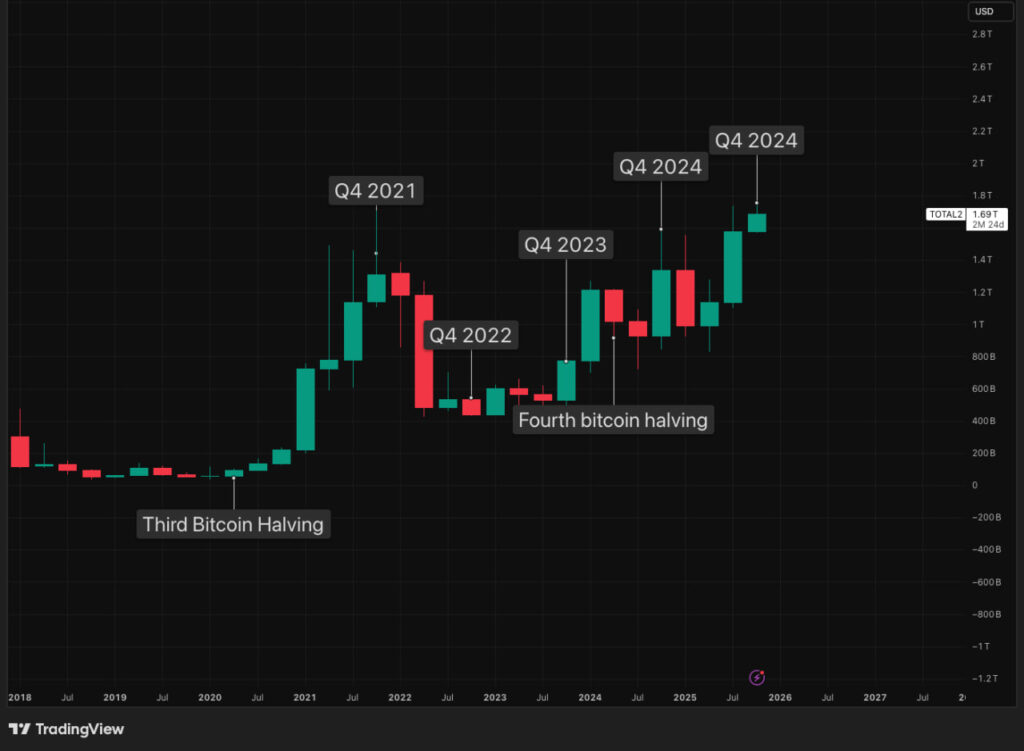
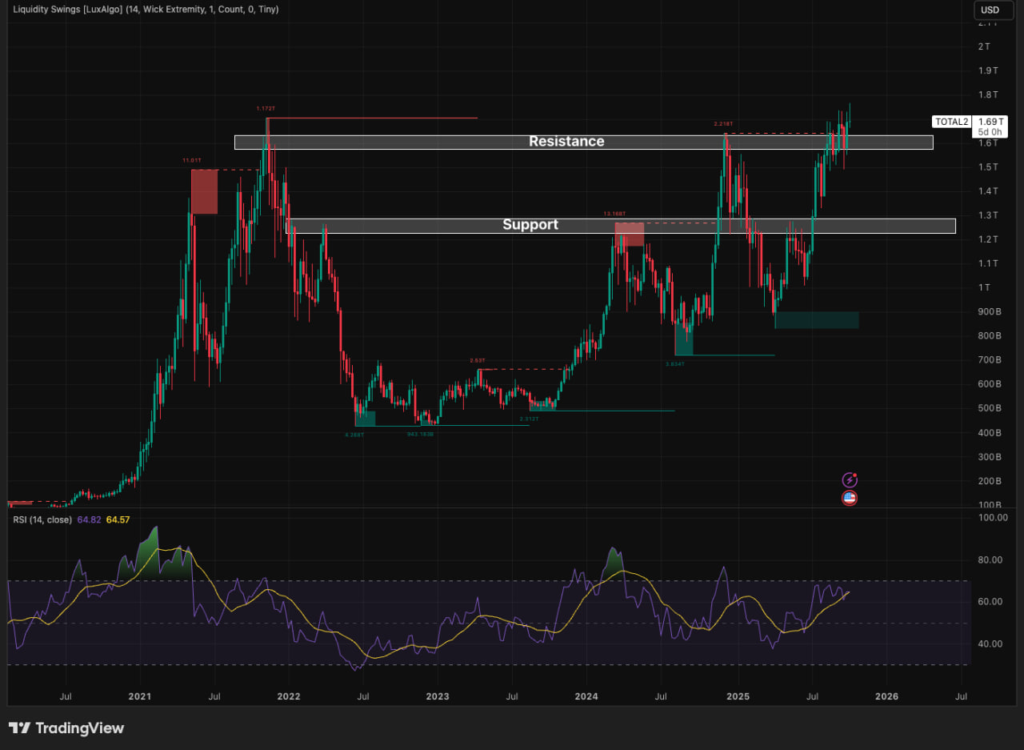
Bitcoin halving is one of the main catalysts that often triggers the beginning of a crypto bull market. Based on the TOTAL2 chart, there is a clear correlation between the post-halving period and a significant increase in altcoin market capitalization.
After each halving, liquidity generally starts to shift from Bitcoin to altcoins or comes from new inflows entering the market, giving rise to a phase known as altseason. This has a significant impact on altcoin movements, often leading to rallies.
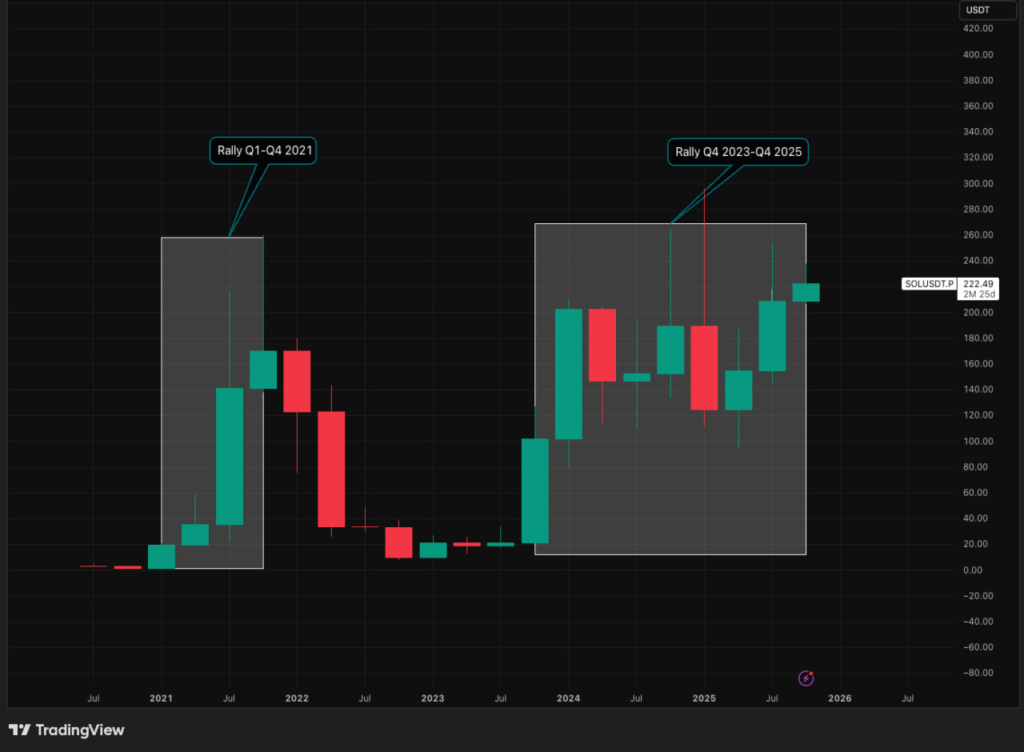
After the third Bitcoin halving, $SOL experienced a strong rally throughout Q1 to Q4 2021. This movement was also reflected in the TOTAL2 chart, which showed a significant surge in overall altcoin market capitalization, including $SOL.
By understanding the correlation between halving, TOTAL2, and altseason, you can anticipate potential major movements in the crypto market, both leading up to peaks and at the end of a bull market phase, based on historical patterns.
However, this index should not be used as the sole reference for trading decisions. Conduct thorough analysis before executing any positions.
For example, in Q4 2023, the rally during that period occurred before the Bitcoin halving, and this movement was reflected in a spike in altcoin market capitalization visible on the TOTAL2 chart.
This demonstrates that altseason does not always follow halving events. Investor expectations, macroeconomic conditions, liquidity flows, or specific project catalysts can accelerate liquidity into altcoins.
Therefore, it is crucial to consider the context behind a surge, whether it is driven by speculative money, fundamental news, or macroeconomic factors.
How to Read TOTAL2 Chart
After understanding that TOTAL2 can serve as an important indicator for observing historical bull and bear market patterns, particularly in relation to specific events or catalysts, here’s how to analyze the TOTAL2 chart on TradingView:
1.Go to tradingview.com
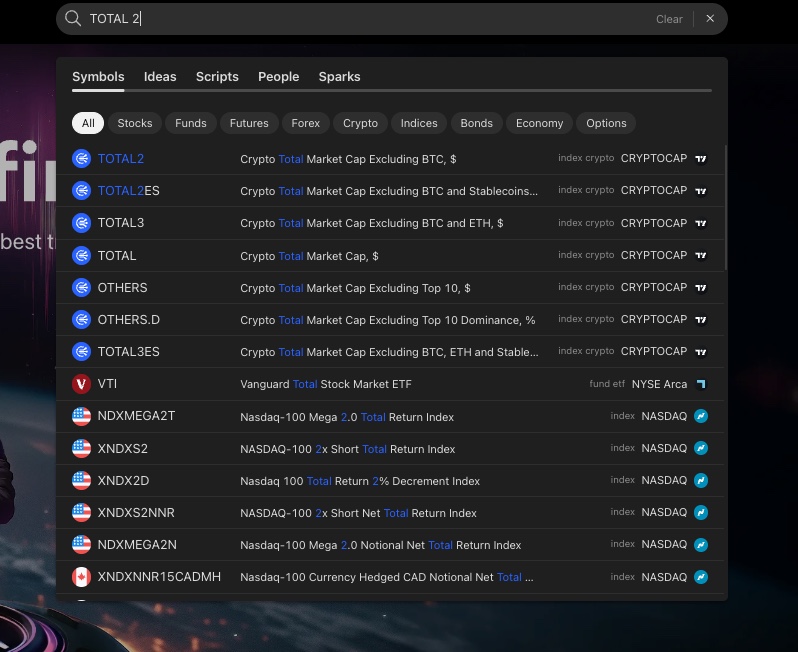
2.Search for the symbol “TOTAL2”
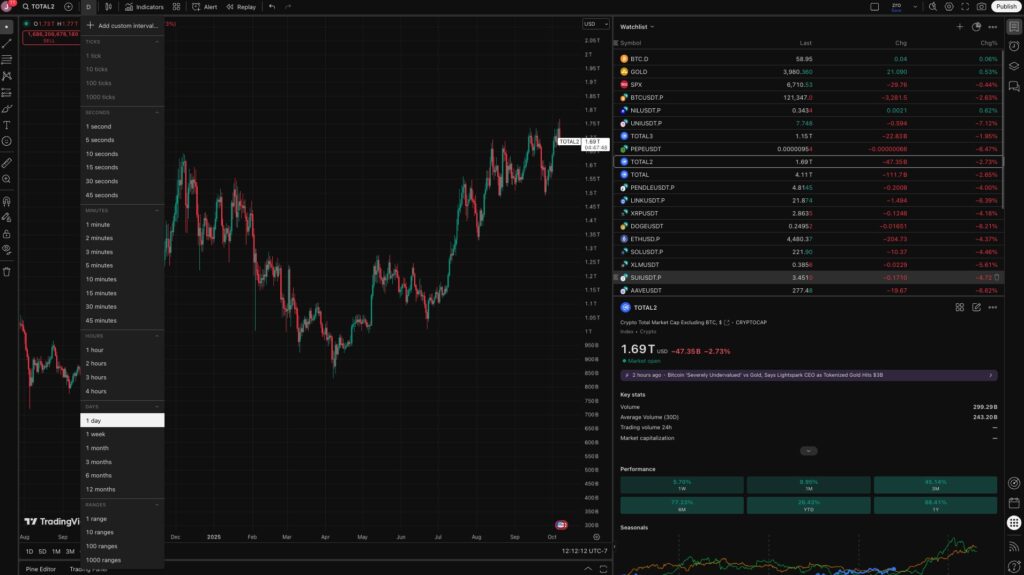
In the search bar, type “TOTAL2” and select “TOTAL2 Crypto Total Market Cap Excluding BTC, $” to display the total market capitalization of altcoins excluding Bitcoin.
3.Select a Timeframe
Adjust the timeframe according to your analysis needs. Use daily for short-term trends, or weekly and monthly to observe long-term trend structures.
4.Add Technical Indicators (Optional)
5.Interpret the Results
Observe whether the trend is bullish, bearish, or consolidating. By understanding this structure, you can identify market phases and potential shifts of liquidity into altcoins.
Best Times To Analyze TOTAL2
After learning how to read TOTAL2, you can use it as an additional indicator to better understand market structure. Here are moments when the TOTAL2 chart can be particularly useful for traders:
1. When Bitcoin Experiences a Correction
When Bitcoin undergoes a correction, most altcoins are usually affected as well. By observing the TOTAL2 chart, you can assess the extent of selling pressure in the altcoin market. If TOTAL2 drops more sharply than Bitcoin’s price, it may indicate weakening market confidence in altcoins or a rotation of funds back into Bitcoin or out of the crypto market entirely.
2. When Your Portfolio is Dominated by Altcoins
If most of the assets in your portfolio are altcoins, using TOTAL2 as an additional reference is a better approach to understanding the market. Through this chart, you can identify trend changes in the altcoin market, from correction and consolidation phases to potential upward trends.
Start Investing in Altcoins on Pintu
After understanding TOTAL2, you can buy altcoins such as ETH, SOL, XRP, BNB, and other altcoins directly on the Pintu app. Everything is available in a single, secure, and user-friendly application suitable for both beginners and experienced investors.
Here’s how to purchase crypto assets on Pintu:
- Go to the Pintu homepage.
- Navigate to the Market page.
- Search for and select the crypto asset you have analyzed.
- Enter the amount you wish to buy and follow the subsequent steps.
Conclusion
TOTAL2 can serve as a useful additional indicator for traders to understand the altcoin market through market capitalization metrics. By monitoring TOTAL2, traders can gain insights into altcoin market trends, whether on a cyclical, daily, weekly, or monthly basis, affected by factors such as macroeconomic conditions. It is important to remember that TOTAL2 should be used as a supplementary reference, not the sole indicator, when making trading decisions.
Disclaimer: All articles from Pintu Academy are intended for educational purposes only and do not constitute financial advice.
References
- “TOTAL2”, Ledger Academy, accesed on Oktober 7, 2025.
- “Global Cryptocurrency Market Cap Charts”, Coingecko, accesed on Oktober 7, 2025.