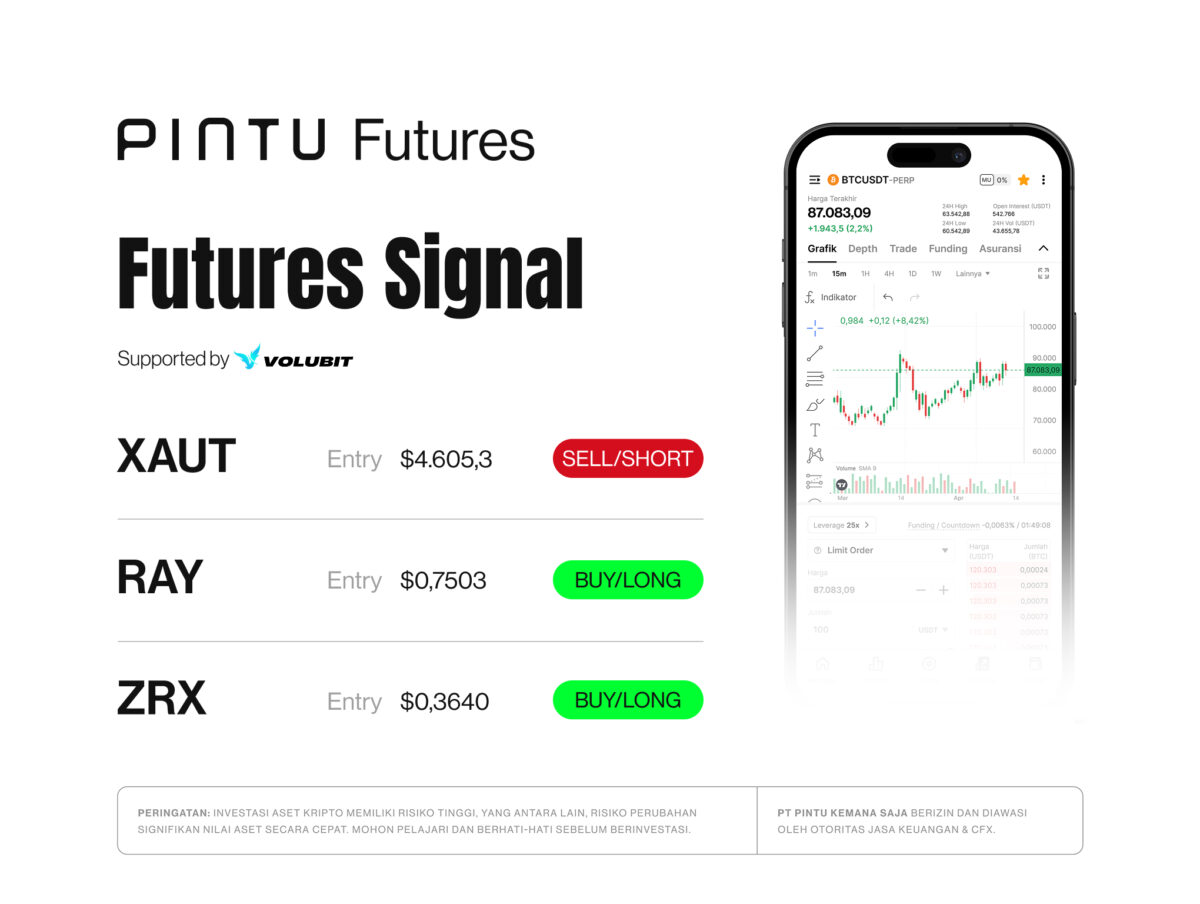
Signal Summary
| Token | Direction | Entry Area | TP 1 |
|---|---|---|---|
| XAUT | SHORT | $4,605.3 | $4,551.6 |
| RAY | LONG | $0.7503 | $0.8042 |
| TIA | LONG | $0.3640 | $0.3871 |
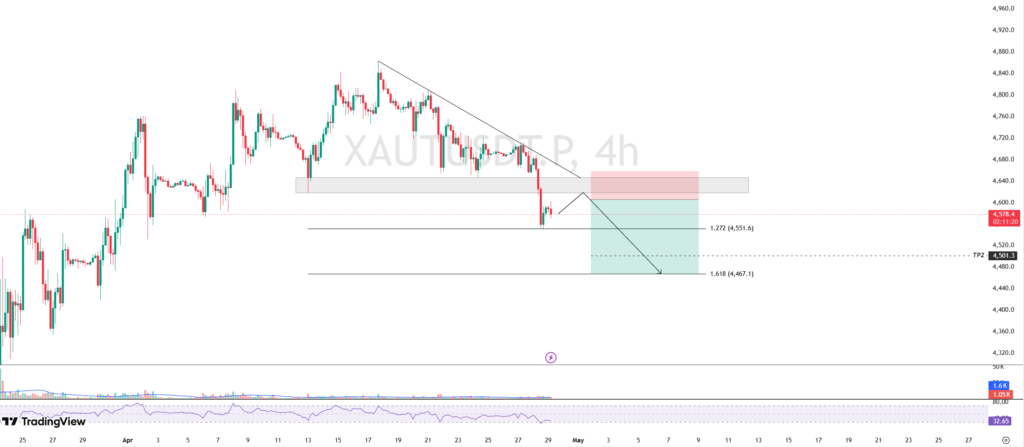
XAUT Tokenized Assets
Analyst Insight:
XAUT’s price movement indicates a weakening signal after successfully breaking down from the support area at $4,618.1 – $4,646.8. This area is now experiencing a role reversal, turning into a resistance and making it a crucial zone to monitor for potential trend continuation.
Under these conditions, this resistance area becomes an ideal waiting zone (sell zone), especially if the price retests the level and shows signs of rejection.
If a valid rejection occurs—marked by a bearish candle and an increase in selling volume—XAUT has the potential to continue its decline towards the nearest support at $4,551.6, with further targets at lower levels.
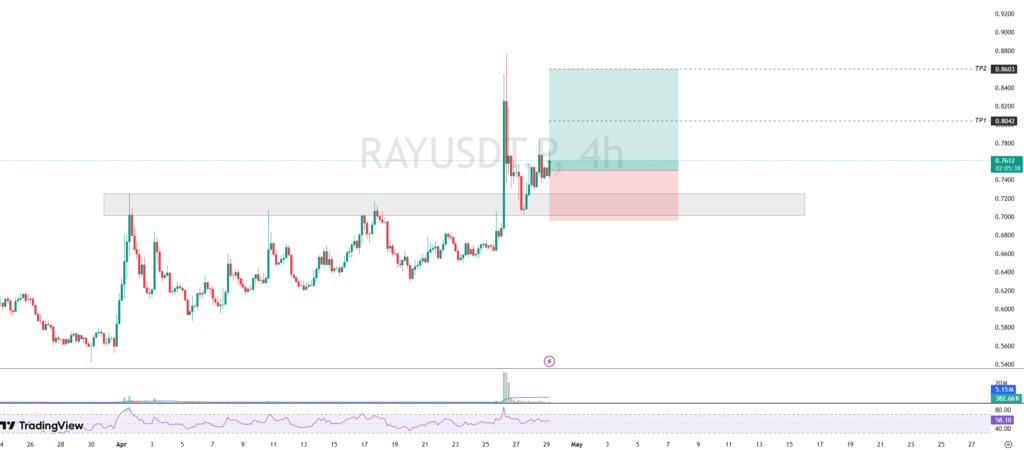
Raydium
DEXAnalyst Insight:
RAY’s price movement is showing signs of recovery (rebound) after previously experiencing selling pressure and finally finding strong support in the $0.7015 – $0.7252 area. The price reaction in this zone indicates accumulation, where buying pressure has successfully reversed the trend from downward to upward.
As long as the price can hold above this support area, the short-term structure is likely to turn bullish, with the potential for a strong continuation of the uptrend.
The immediate upside target is around $0.8042, while the main target is at $0.8603, which acts as the next resistance area.
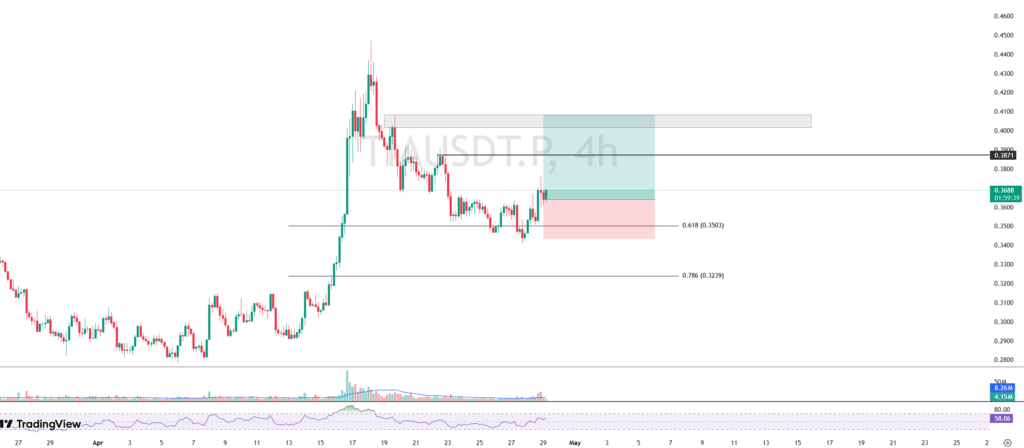
Celestia
Layer-1Analyst Insight:
TIA’s price movement shows a strong rebound signal after previously experiencing a decline and successfully finding support in the $0.3503 area, which is a harmonic support as well as reflecting the golden ratio (Fibonacci retracement)—a zone that often becomes a potential reversal point.
A positive reaction from that area indicates significant buying interest, thereby opening the opportunity for a momentum shift from bearish to bullish in the short term.
As long as the price is able to hold above the $0.3503 level, the upside potential remains open, with the nearest target at $0.3871 and further targets in the $0.4017 – $0.4084 area which becomes the next resistance.
Important Note: Always apply disciplined risk and capital management. For trading, especially when using leverage, it is best to use a risk per trade of: 1% of total capital.
Disclaimer: Pintu Futures activities (crypto asset futures trading) are conducted by PT Pintu Kemana Saja (Digital Financial Asset Trader), a Futures Broker company licensed and supervised by Bappebti and a member of CFX and KKI. Trading crypto asset futures involves a high level of risk, one of which is the risk where Leverage can amplify both profits and losses.