
The US Bank sector experienced massive problems last week. SVB, Signature, and Silvergate banks were bailed by the US government due to bankruptcy. In the aftermath of these events, Bitcoin experienced explosive price movements during the week and touched $28.4k dollars. So, will this rally continue? What about the current macroeconomic conditions? Will the Fed continue its rate hikes?
As usual, the Pintu trader team has collected various crypto and macroeconomic data to analyze the crypto market movements over the past week. However, you should note that all information in this Market Analysis is for educational purposes, not financial advice.
Market Analysis Summary
- 📉 The annual CPI report in February shows inflation at 6%, down from 6.4% in January. Core inflation came in at 5%, down 0.5% from January. All these figures were in line with expectations and February was the eighth consecutive month in which the annual inflation rate has declined.
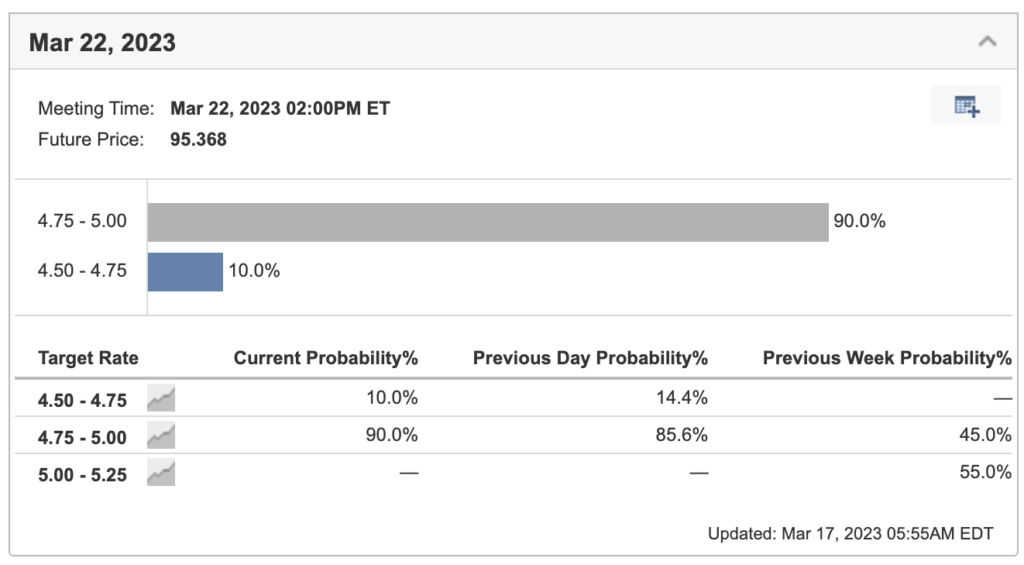
- ⚖️ The Fed is facing a dilemma due to the banking sector problems. The inflation number shows the Fed needs more time to bring it down to the target range but increasing interest rates too drastically could potentially worsen the banking situation. The Fed is likely to raise interest rates by 0.25% at the March 22nd FOMC meeting.
- 🏦The US government intervenes to save several banks such as Signature, SVB, and Silvergate that were in trouble. Credit Suisse in Switzerland also faced problems and had to borrow up to $50 billion dollars from its Central Bank.
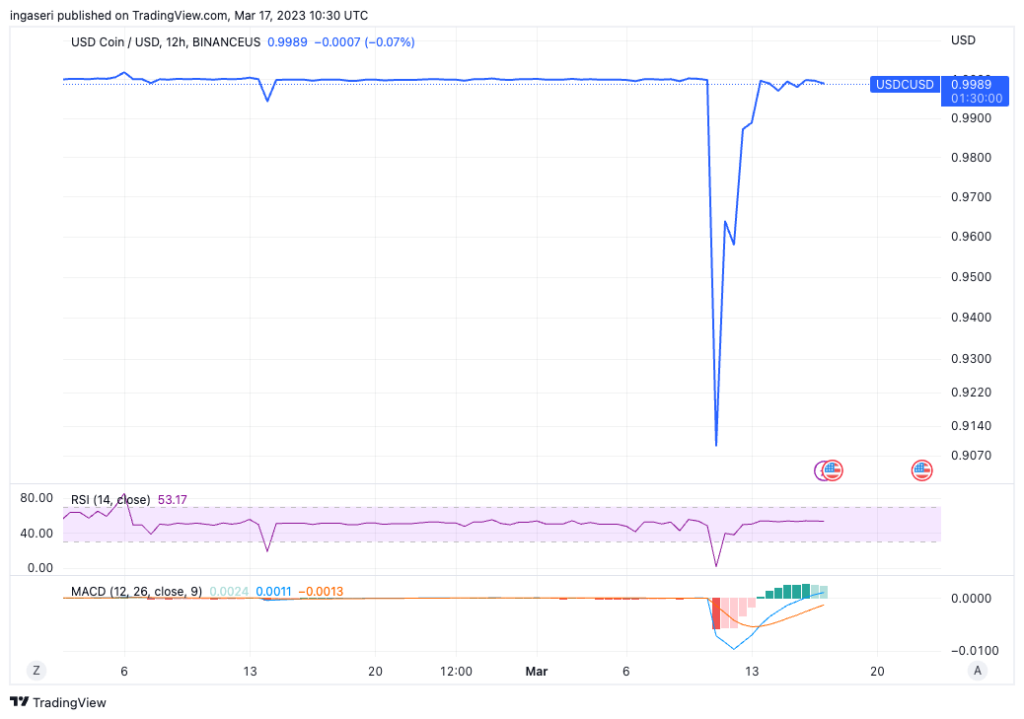
- 💸 These banking issues spill over into the crypto industry with USDC depegging as SVB holds the reserve assets. USDC price has now returned to normal.
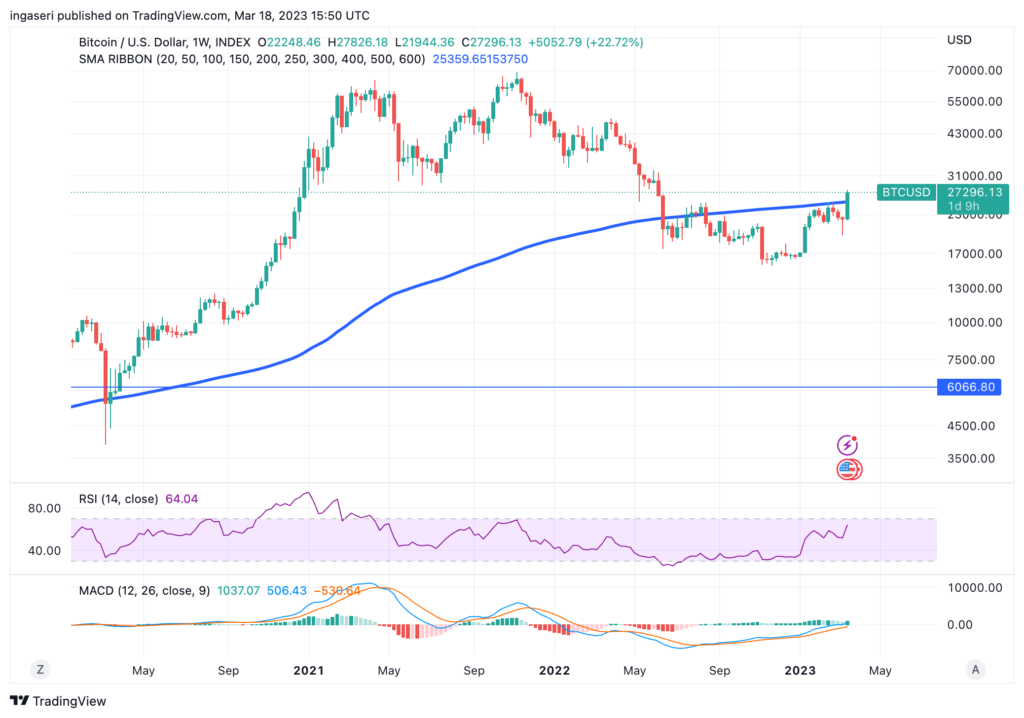
- 🧠 BTC showed its strength by rallying +23% in the past week. Bitcoin needs to close the week above the 200-Week EMA in order to continue its positive trend.
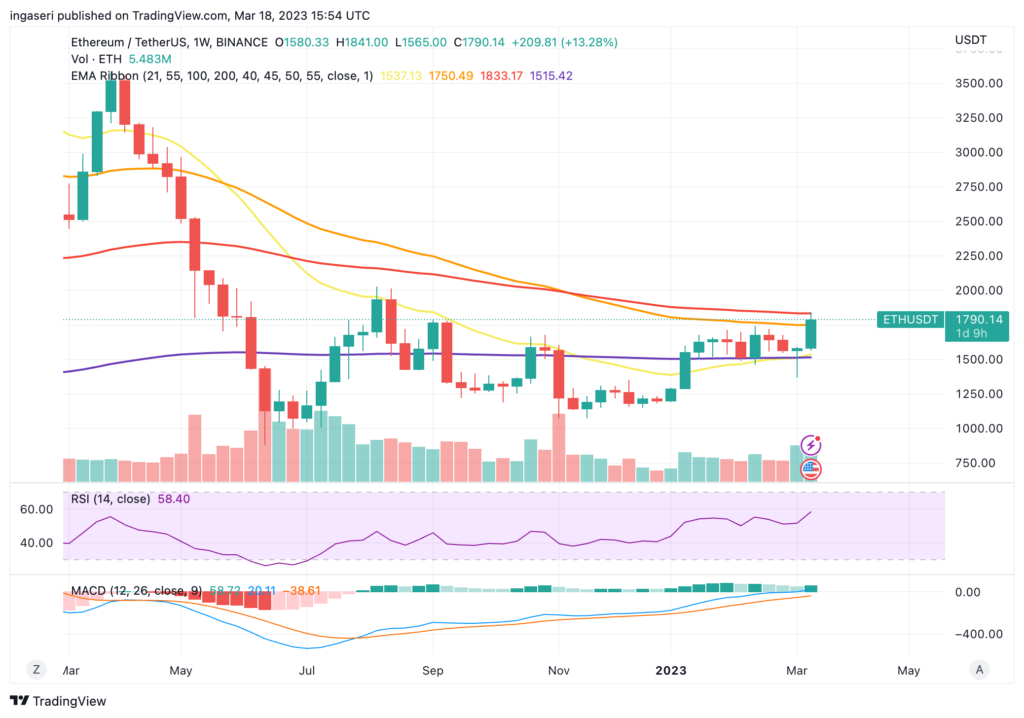
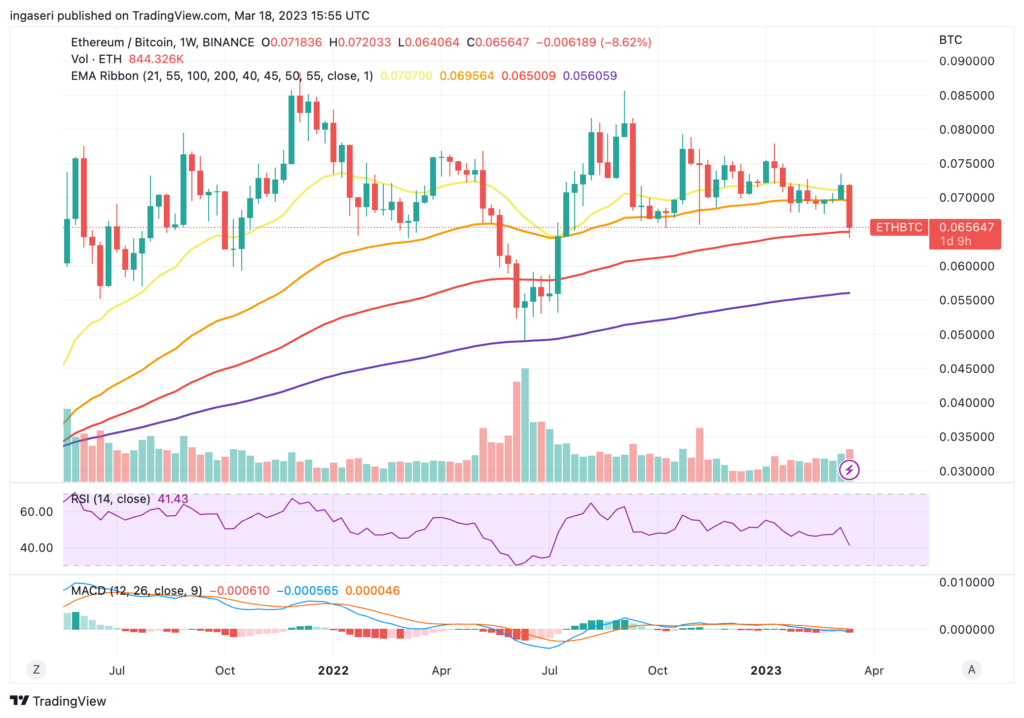
- 💭 ETH/BTC price chart shows ETH is weaker relative to BTC as it fell from the 21 and 55 weeks EMA and found support at the 100-week MA.
Macroeconomic Analysis
The CPI was recorded at 6% for the year that ended in February, a decrease from January’s 6.4%. Core inflation is at 5%, 0.5% lower than January’s 5.5%. These numbers came in as expected. Additionally, this is the eighth consecutive month where the yearly rate has decreased, and it represents the lowest level observed since September 2021.

Before the upcoming policymaking meeting of the Federal Reserve next week, the release of CPI is one of the remaining significant economic data points. Nevertheless, The Fed’s struggle against inflation has become more intricate in recent times. In response to the collapse of Silvergate, SVB, and Signature Bank, The Fed has joined forces with the Treasury and the FDIC to try to prevent wider repercussions.
While there were some overall declines, Tuesday’s CPI report suggests that it may take longer for the inflation rate to reach the Federal Reserve’s desired 2% target. The recent acceleration in core inflation, in combination with the strong jobs report from last Friday and Fed’s semiannual report to Congress, would have led the Fed to raise rates by 50 bps on March 22 if not for recent banking system instability. However, The Fed now finds itself in a dilemma: it wants to maintain its credibility on inflation and prevent the further acceleration of core inflation, but it also needs to investigate the impact on the financial conditions due to recent bank collapses and reduce the risk of further financial instability.
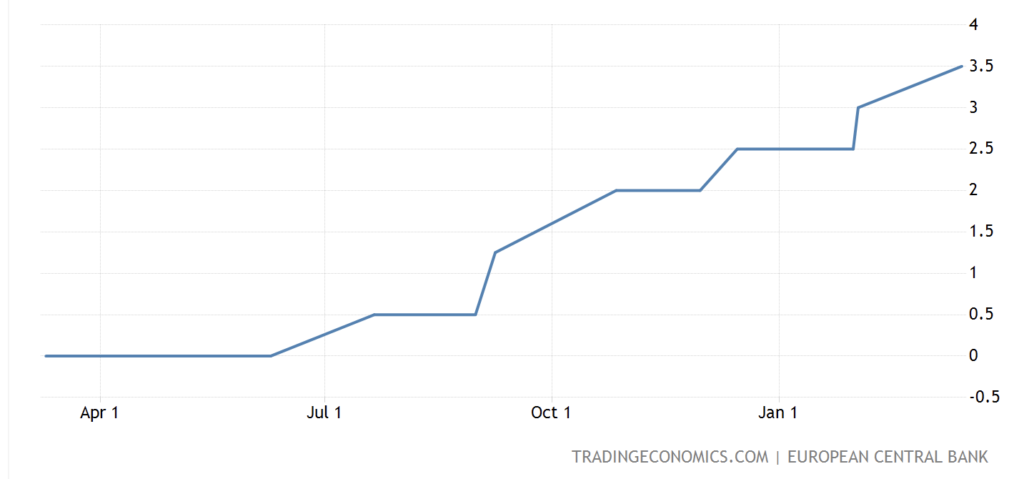
The ECB has raised its interest rates by 50 bps to 3.5%, a move that officials had been indicating since their previous meeting six weeks ago, which was also in line with the expectations of most economists.
A majority of economists have a narrow expectation that the Fed will hike interest rates next week, and also gradually raise the peak interest rate in response to high inflation, despite concerns about a banking crisis that could have a broader impact on the economy. The Fed is likely to raise rates by 0.25% at its March 21-22 meeting, as well as at the next two meetings, ultimately reaching a range of 5.25% to 5.5%.
Earlier this week we saw SVB’s collapse. It all started during the pandemic when the bank accumulated a significant amount of deposits, and SVB invested tens of billions of dollars in bonds. This happened right before the Fed commenced its efforts to combat inflation by raising rates. Consequently, when the rates escalated, the value of those holdings plummeted, resulting in significant losses. This precarious situation left the bank in a dire position.
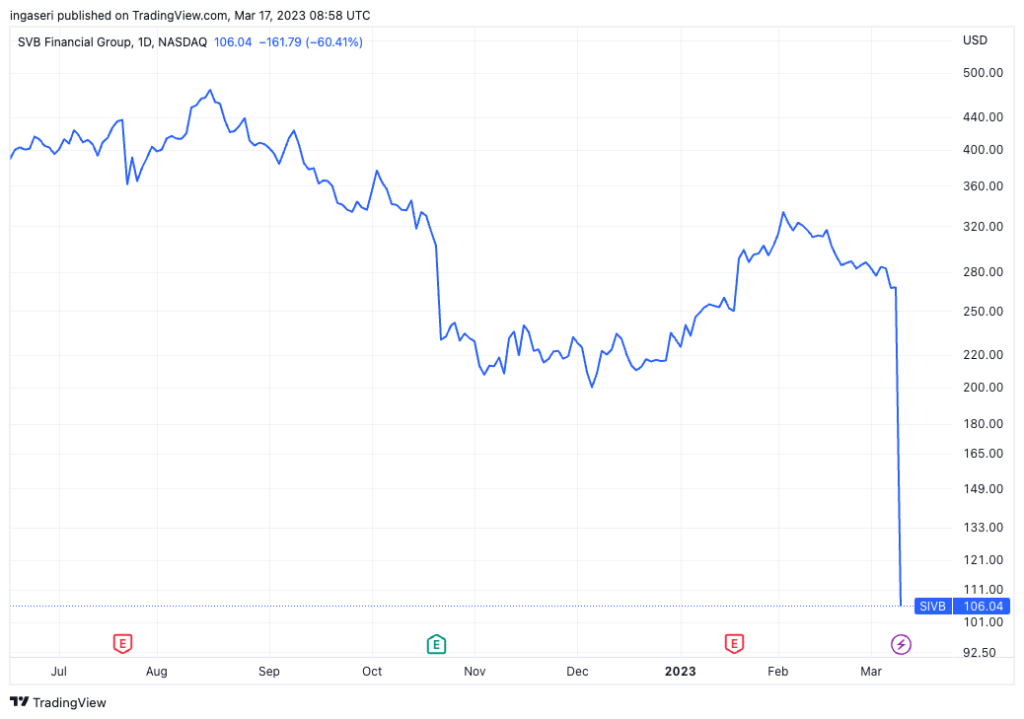
In an attempt to instill confidence, the bank raised money on 9th March. However, this move had the opposite effect, as depositors quickly withdrew their funds in large numbers, leading to a classic bank run. As a result, regulators had to take emergency measures and seize SVB on the following day to prevent the sudden collapse from spreading and causing a more significant financial crisis.
Typically, a bank of SVB’s size usually has millions of depositors small enough to fall under the $250K USD FDIC cap. SVB on the other hand was composed of mainly venture capitalists and only 6% of the depositors were insured. So when the panic started, it triggered a massive pullout from these big clients.
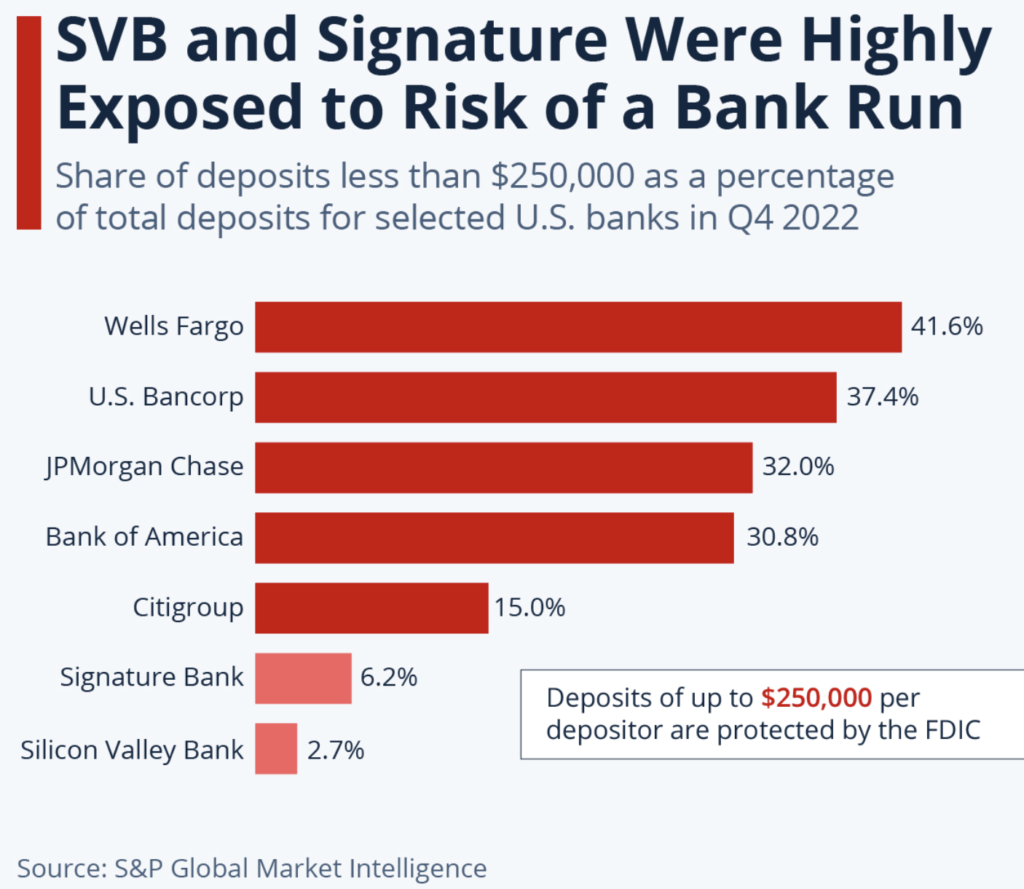
Following the SVB saga, Signature Bank has been closed and placed under FDIC receivership. Signature has been the third bank to do so, after Silvergate and SVB.
The aftermath of the 3 banks closing has led people to line up to take their money out of the First Republic Bank. Despite securing $70 billion in new financing from the Fed and J.P. Morgan Chase, First Republic has witnessed a significant loss of depositors following the failures of the three banks. Many customers have transferred their funds to larger competitors. Despite its reassurance that its balance sheet is sound and that depositors’ funds are secure, investors remain concerned about the possibility of a deposit run similar to that of SVB.
The closure of these banks by regulators has led to increasing concerns about the stability and security of the banking system. This has resulted in a decline in shares of small and regional banks in the US, as investors fear the possibility of similar collapses in other banks, despite no indication of any systemic issues.
The anxiety about the banking system’s health has spread globally, causing ripple effects in other parts of the world. On Wednesday, Credit Suisse’s stocks plummeted as its largest investor announced its decision not to inject any further funds into the bank, which is undergoing a major overhaul. However, the situation has improved for Switzerland’s 2nd largest bank after it revealed that it would be borrowing up to $50 billion from the country’s central bank.
USDC Depegging
Over the week, the USDC stablecoin found itself in the midst of the banking turmoil as it depegged against the US Dollars. Circle, the issuer of USD Coin, the second largest stablecoin, saw a net redemption of $3 billion from Monday to Wednesday. Over the weekend, USDC value deviates from its $1 peg due to the revelation that $3.3 billion of the token’s reserves were held by the collapsed SVB. It has since recovered.
BTC Analysis
The crypto market rallied after news broke that SVB will be placed under receivership, effectively ending the USDC depegging crisis. BTC rallied for +23% over the week and the overall crypto market gained 12% over the week, surpassing the 1 trillion mark once again. Expect BTC to find support after its hot run over the week.
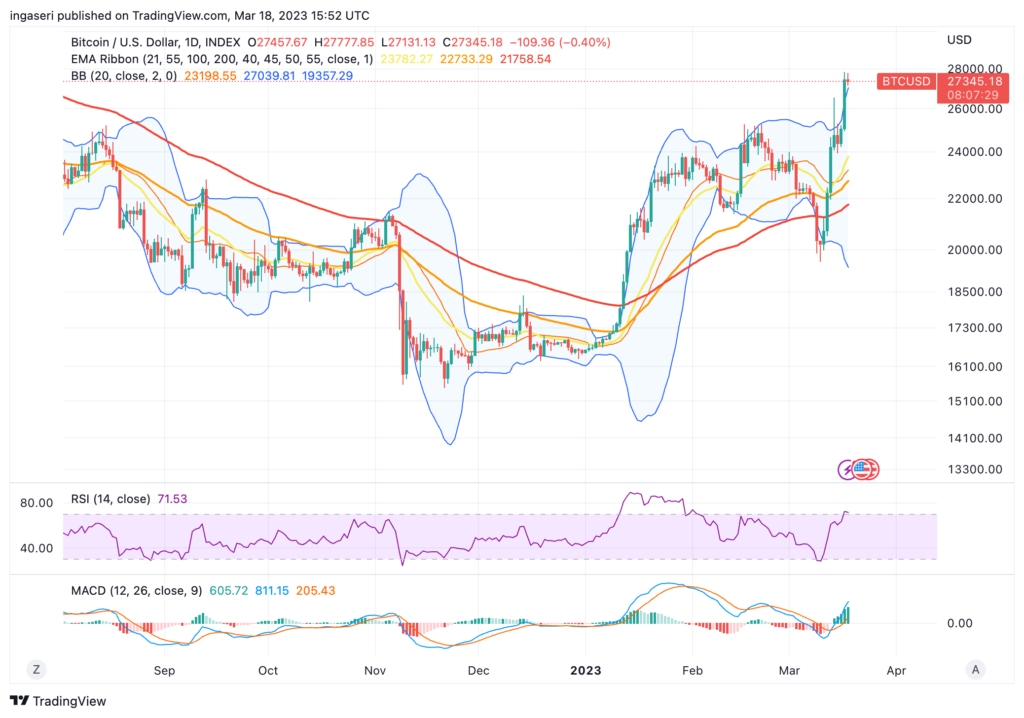

The key point to watch is the 200-week SMA on BTC, which is the blue line below. Should we close above the blue line, expect BTC to establish support next week to ensure that we have bottomed.
ETH Analysis
ETH has gained 10% over the week, only to get resisted at the 55 weeks EMA (orange line). Additionally, ETH has performed poorly over the week vs BTC as we see ETH/BTC plunged over the 21 and 55 weeks EMA, holding support at 100 weeks MA.
On-Chain Analysis:
Exchange: As the exchange reserve continues to rise, it indicates higher selling pressure. Net deposits on exchanges are low compared to the 7-day average. Lower deposits can be interpreted as lower selling pressure.
Miner: Miners’ are selling holdings in a moderate range compared to their one-year average. Miner’s revenue is in a moderate range, compared to its one-year average.
On-chain: More investors are selling at a profit. In the middle of a bull market, it can indicate a market top. Long-term holders’ movement in the last 7 days was lower than the average. They have the motive to hold their coins. Investors are in a fear phase where they are currently with unrealized profits that are slightly more than losses.
Derivatives: Long-position traders are dominant and are willing to pay short traders. As open interest increases, it indicates more liquidity, volatility, and attention are coming into the derivative market. The increasing trend in OI could support the current ongoing price trend.
Technicals: RSI indicates a neutral condition. It indicates a neutral condition where the current price is in a moderate location between the highest-lowest range of the last 2 weeks.
Altcoin News
- 🌃 Shanghai Ethereum Upgrade: The Ethereum development team set a new Shanghai Upgrade target date of April 12, 2023. The Shanghai Upgrade will allow the withdrawal of ETH locked in staking.
- ⚙️ Filecoin FVM: Filecoin announced that the March 14 launch of the Filecoin Virtual Machine (FVM) went smoothly. As of March 17, several protocols have successfully run on top of FVM such as Bifrost and Filet Protocol.
Crypto News
- ✈️ Arbitrum ARB Airdrop: Arbitrum’s token, ARB, will be launched on March 23, 2023. ARB will be airdropped to approximately 625 thousand Arbitrum users. The ARB in this airdrop represents 11% of the total supply of 10 billion ARB. In addition, Arbitrum also announced that the launch of ARB signifies Arbitrum’s transition to a DAO governance system.
- 🧠 USDC Back to Normal: Since Monday, March 13, USDC prices have returned to the value of the US dollar. This happened after the Fed announced that it would compensate SVB customers. USDC also explained that all withdrawal processes are running normally. During the depeg, USDC reached as low as $0.87 on March 11, 2023.
- 😭 Euler Finance Hacked: On March 13, 2023, Euler Finance suffered a hack where the attackers made off with over $197 million dollars. Some on-chain investigators explained that the attacker is likely the same one who attacked BSC in February. Currently, the attacker has returned around 3,000 ETH ($5.4 million) to Euler.
Best and Worst Performers of the Crypto Market

Best Performers
- OMG Network (OMG) +69%
- Immutable X (IMX) +54%
- Alchemy Pay (ACH) +34%
- Ren (REN) +32%
Worst Performers
- Maker DAO (MKR) -23%
- ApeCoin (APE) -5%
References
- WuBlockchain, Weekly project updates: Arbitrum airdrop, Uniswap on BNB Chain, Filecoin’s FVM goes live, Substack, accessed on 20 March 2023.
- WuBlockchain, Weekly:ChipMixer shut down、Coinbase partners with Standard Chartered、Fed steps in to save market and Top10 News, Substack, accessed on 20 March 2023.
- Arijit Sarkar, Euler Finance hacker starts returning stolen Ether, Coin Telegraph, accessed on 20 March 2023.