
Bitcoin (BTC) failed to continue its bullish momentum and it is still in the same price channel. On the other hand, Ethereum shows strength after the merge date announcement. Pintu’s team of traders collects data about price movements and the crypto market over the past week. However, note that all information from the market analysis below is for educational and informational purposes only, and not financial advice.
Market Analysis Summary
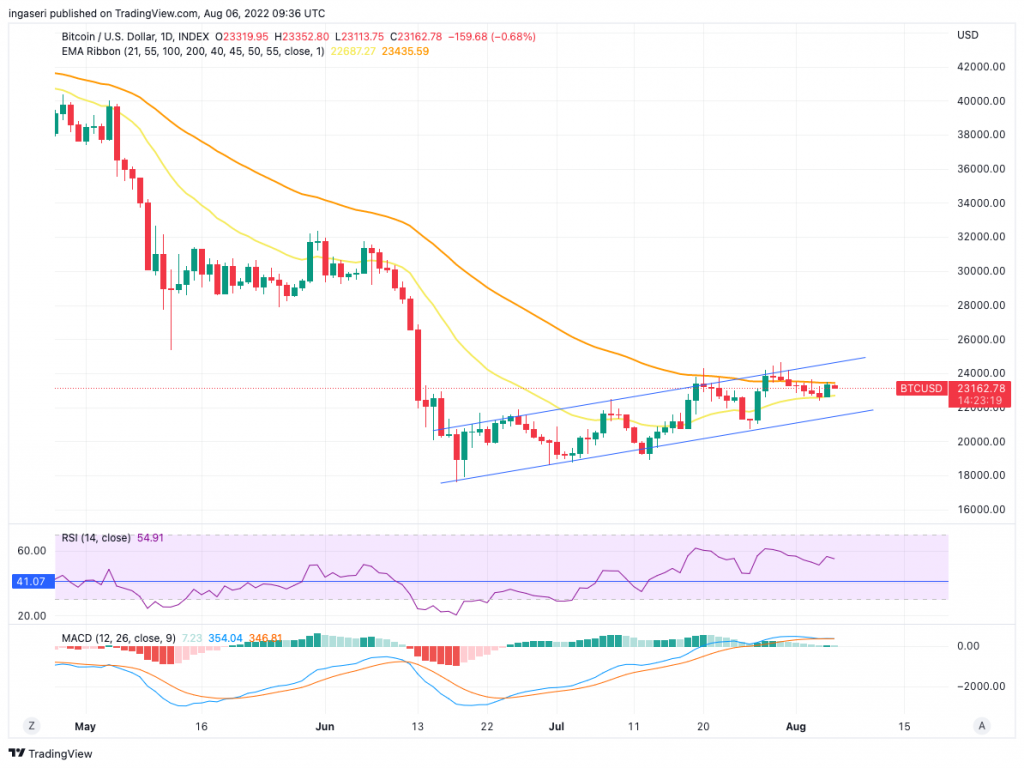
- 🔍 BTC is still in the previous price range in a bearish flag pattern and broke through the 55-day EMA but dropped back down.
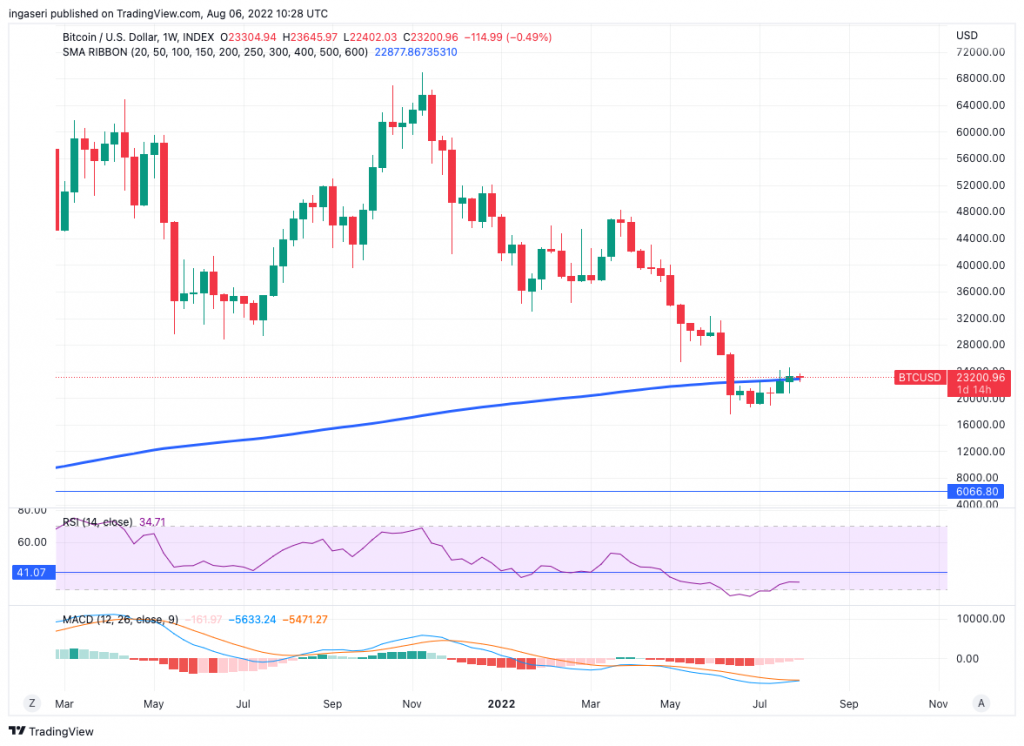
- ️⚖️ Bitcoin still managed to hold on to the 200-week MA support point.
- 💻 The Merge will make ETH a deflationary asset and can be a catalyst to drive up the price of ETH.
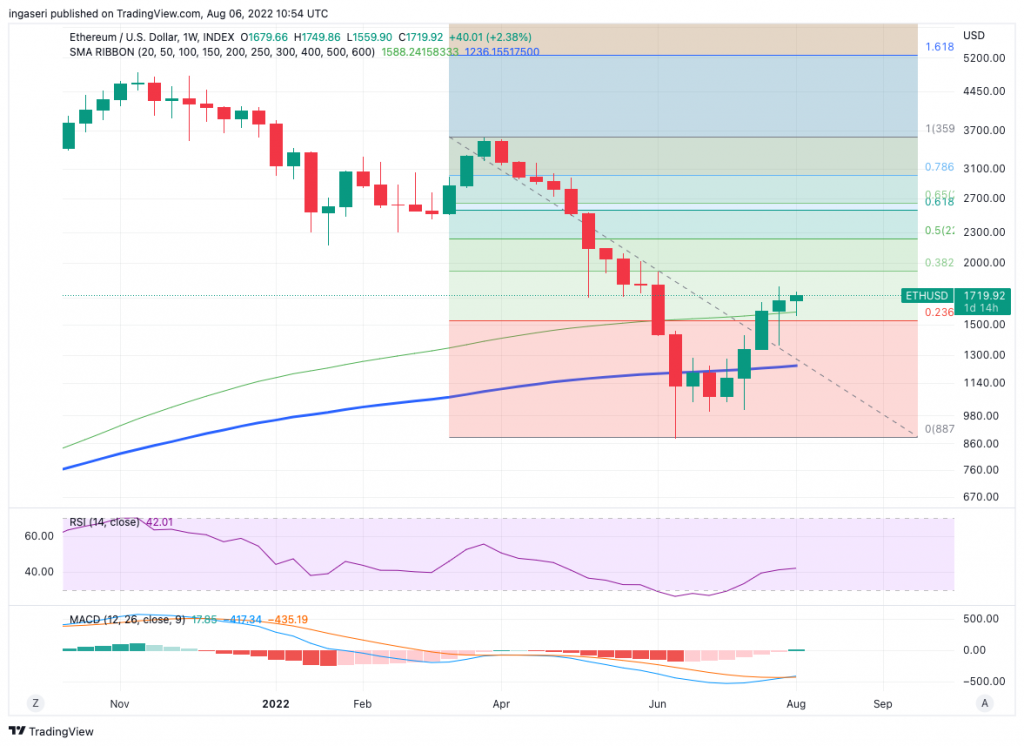
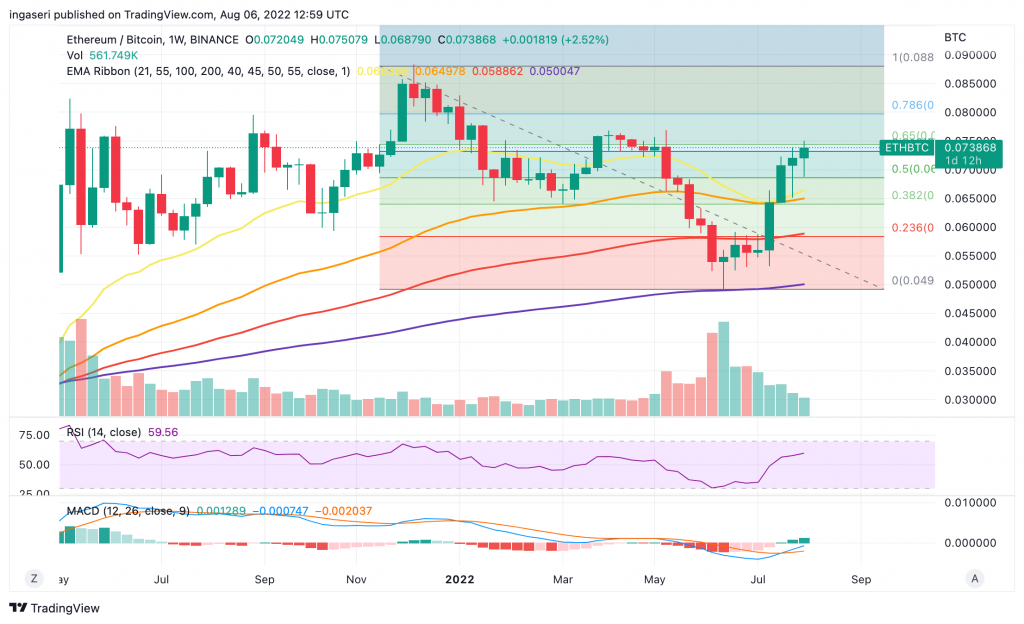
- 💵 ETH and ETH/BTC charts show good performance with a bullish pattern on the weekly chart.
- 🏦 July CPI data will be released on August 10, this data can affect the movement of stock assets.
BTC and ETH Price Movement 31 July-6 August 2022
Over the past week, BTC managed to climb above the 55-day EMA. BTC tried to break out of the bearish flag pattern but failed and went back down. Until there is confirmation of a breakout, BTC will continue to be in the current price range. In case of a bullish signal, the 100-day MA, which is near the $26K US dollar level, will be the first point of resistance before the significant $30K zone. The bearish case is that BTC can fall from its current price range.
On BTC’s weekly chart, we are still at the support point of the historic 200-week moving average, which is usually a good time to accumulate.
The current trend is about The Ethereum Merge, an update that changes it from proof-of-work to more eco-friendly proof-of-stake. This update will occur on September 19 and will merge Ethereum’s mainnet with a PoS system Beacon Chain. However, this will allow the current PoW mainnet to continue to exist, while the new Ethereum Beacon Chain will run using PoS.
Citibank mentions that Ethereum may become a deflationary asset as the issuance of new ETH tokens will decrease while the burning mechanism continues. The Merge can increase transaction speed by 10% by reducing block time. So, block times will drop between 12-13 seconds and transaction fees will also decrease slightly. ETH will then become an eco-friendly digital asset because its energy usage going down by 99.95%.
Furthermore, Citi also explained that The Merge is reducing the issuance of new ETH by 4.2% per annum, and with ETH eventually going into deflation, this will increase the interest of ETH as an asset that stores value.
Since the announcement of the merge, ETH has experienced a bullish momentum, with other altcoins following suit. The TA for ETH is still showing a bullish pattern on the weekly chart. As seen in the chart below, ETH managed to find support at the 150-week moving average. ETH also breakout from the 0.236 Fibonacci retracement line.
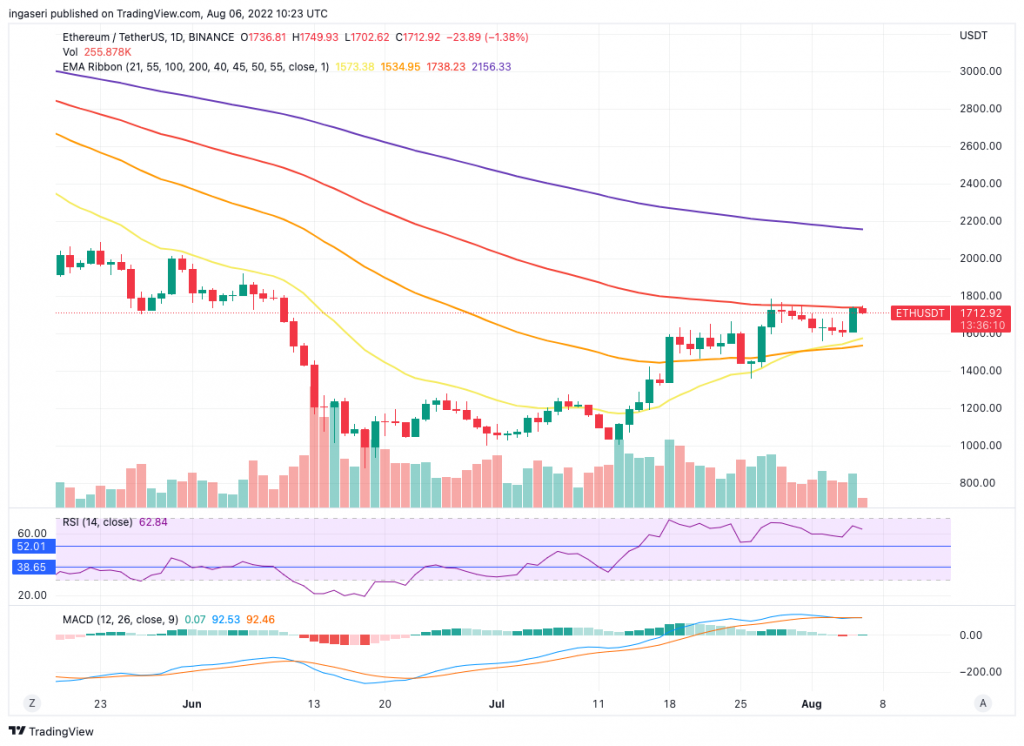
Although ETH managed to cross the 21 and 55-day EMA lines, it failed to break through the 100-day EMA. ETH needs to break this resistance line to form a short-term bullish momentum.
It is currently the 5th week of the green candlestick on the ETH/BTC chart. ETH is rejected in the Fibonacci gold pocket area. If it manages to exit this area, ETH will experience a significant move towards the upside.
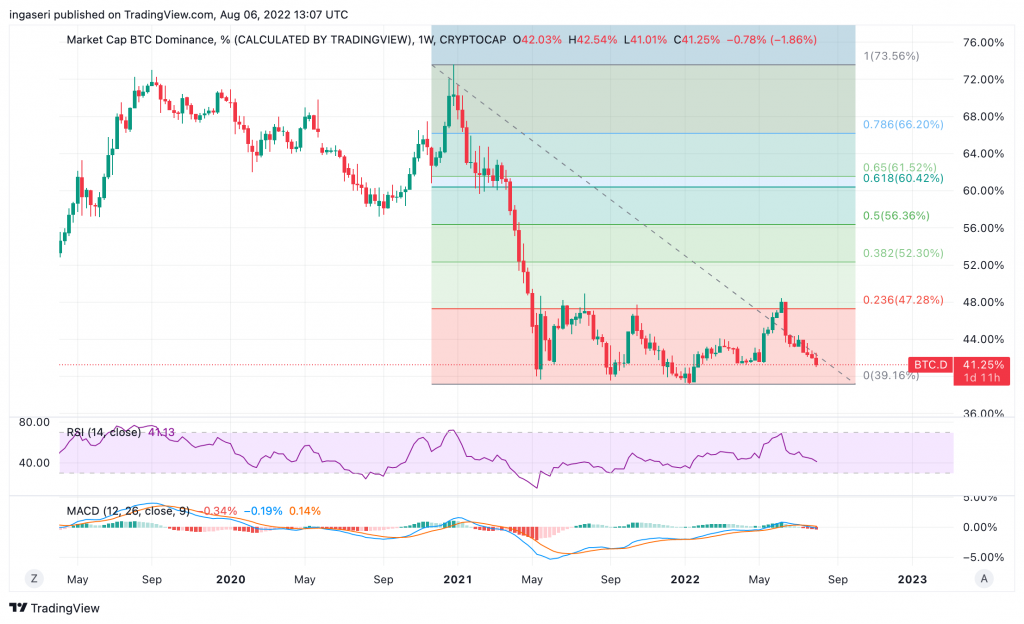
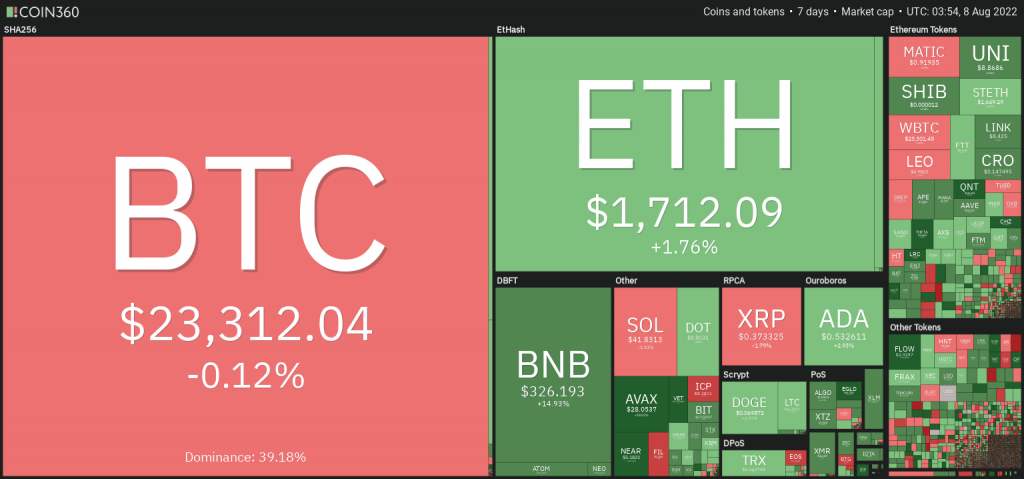
There is significant upward momentum in Altcoins following the news of the ETH update. We can see the dominance of BTC has been continuously falling since Mid-June. The current level is 41.25%.
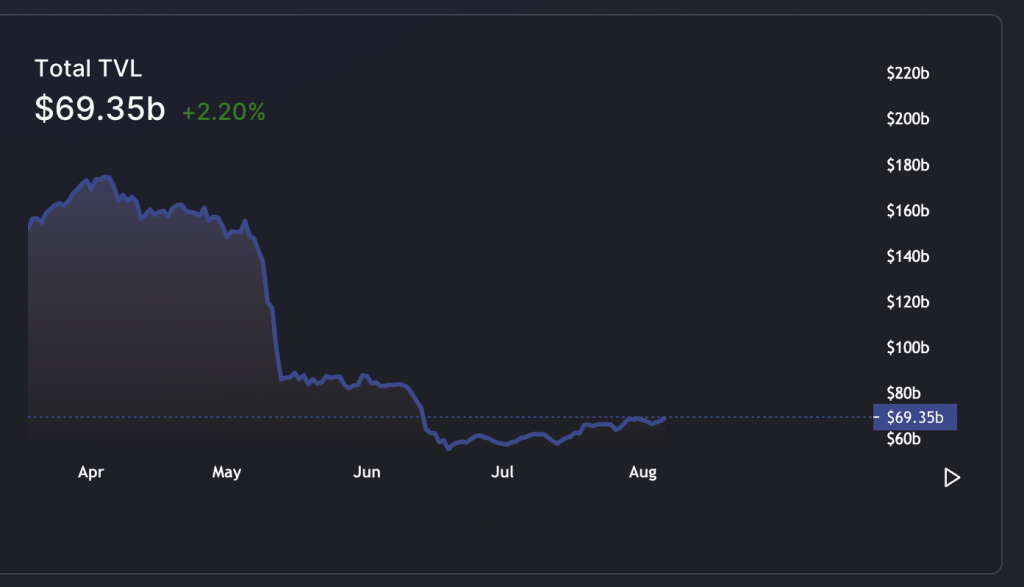
TVL (total value locked) has experienced positive growth since mid-June. It manages to climb from $55 billion US dollars in mid-June to $69 billion today.
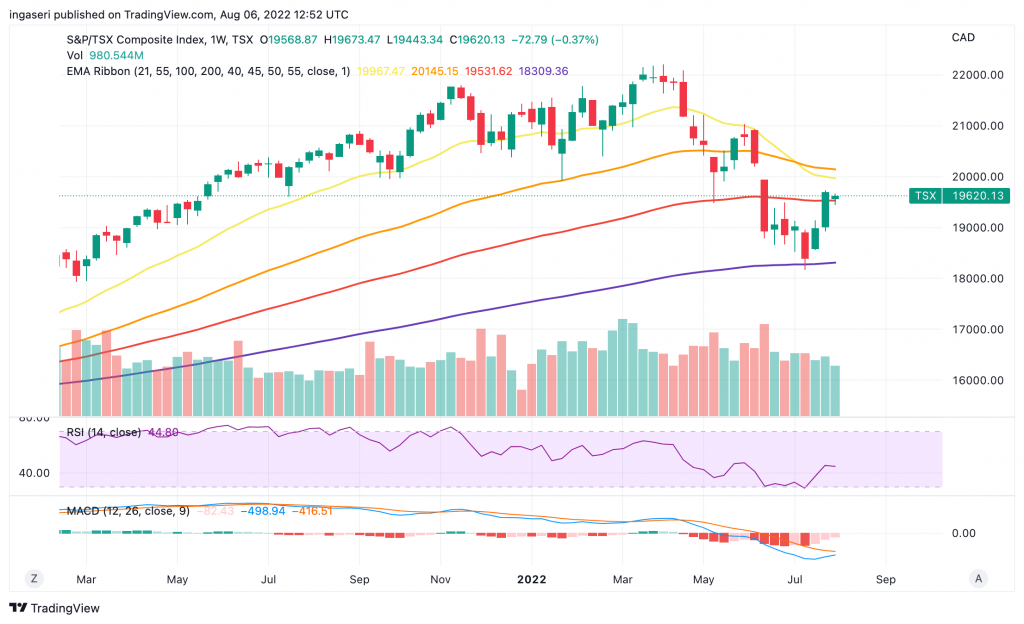
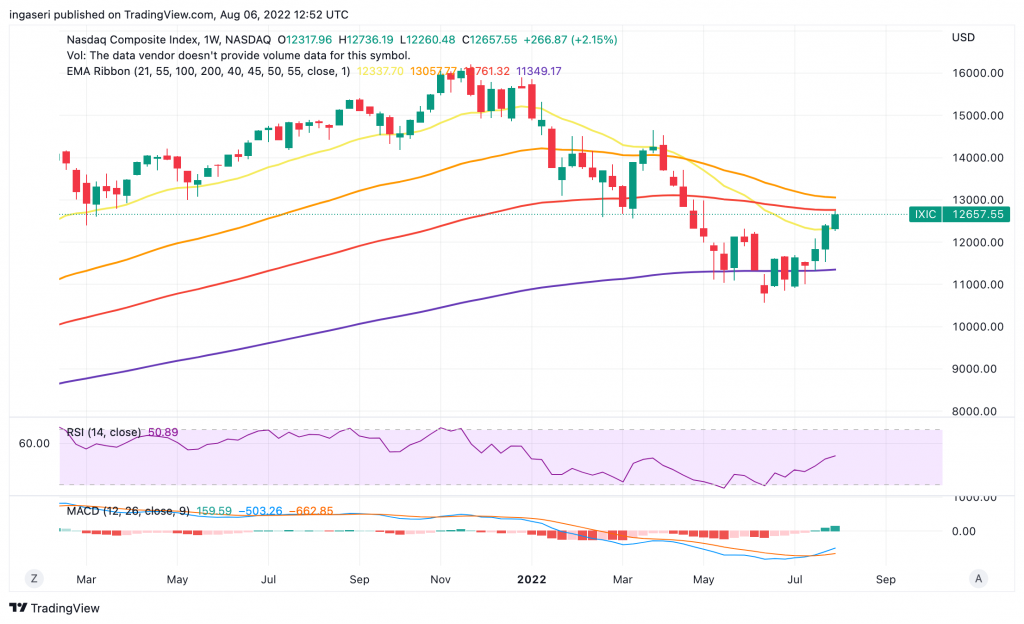
Stock Market and US Dollar Movements.
The stock market is showing strength as the S&P (+0.37% WoW) and Nasdaq (+2.15% WoW) continue their positive momentum. However, there is a risk of overheated momentum (too much buying) as we head towards the July CPI announcement on August 10th. This happens because the new earnings reports of large companies are not as bad as investors fear. This is one of the reasons why the stock market has rallied in recent weeks.
Since the middle of last week, about 70% of S&P 500 companies reported their Q2 earnings. The revenue figure beat the consensus forecast of 2.5%, and the earning figure has topped the 5.6% forecast so far.
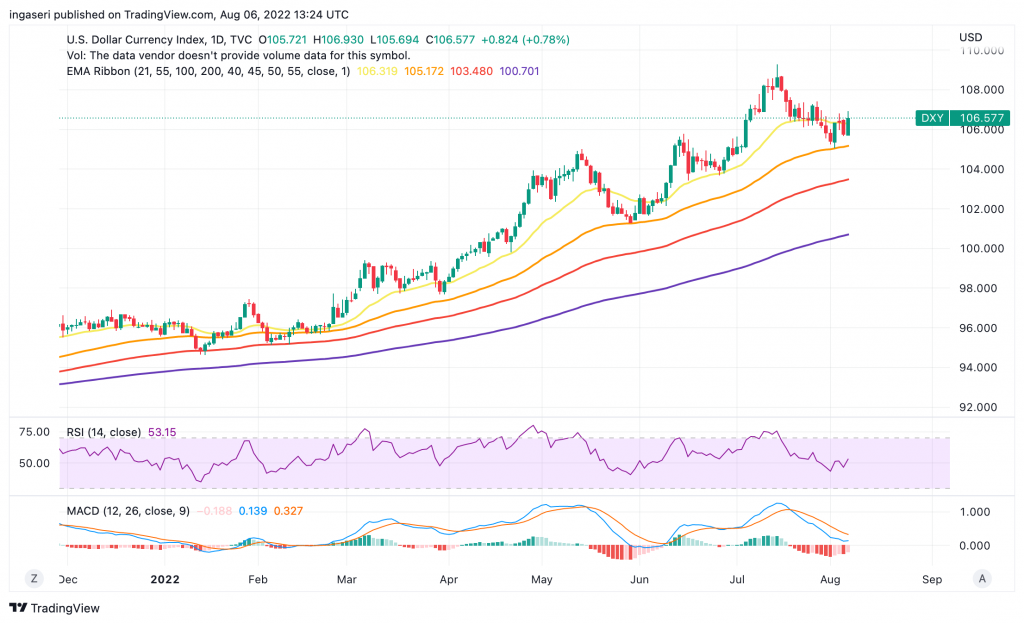
The chart of the US dollar index continues the positive trend, as can be seen in the chart below. Currently, it is undergoing a correction and supported at the 21-week line.
On-Chain Analysis
Exchange: Net deposits on exchanges are high compared to the 7-day average. Higher deposits can be interpreted as higher selling pressure.
Miner: Miners are selling holdings in a moderate range compared to their one-year average. Miner’s revenue is in a moderate range, compared to its one-year average.
On-chain: More investors are selling at a loss. In the middle of a bear market, it can indicate a market bottom. Long-term holders’ movement in the last 7 days was lower than the average. So, they have a motive to hold their coins. Currently, investors are in a fear phase where they have unrealized profits that are slightly more than losses.
Derivatives: Long position traders are dominant and are willing to pay short traders. Buying sentiment is dominant in the derivatives market. More buy orders are filled by takers. As OI decreases, it indicates investors are closing futures positions and the possibility of trend reversals. In turn, this might trigger the possibility of a long/short-squeeze caused by sudden price movement or vice versa.
News From the Altcoins World
- ️🕵️ Solana Digital Wallet Hack: Approximately 7,000 digital wallets on the Solana network were stolen in a $4.5 million US dollar hack. Solana’s investigation explained that this hack occurred in the Phantom and Slope digital wallets on the browser and smartphone platforms.
- 💻 Ethereum PoW Dilemma: Several Ethereum miners are currently consolidating to continue supporting the proof-of-work (PoW) version of Ethereum. The Merge will move Ethereum to a proof-of-stake (PoS) network and will displace Ethereum’s mining industry’s $5 billion worth of tools. The position of the mining community is similar to the Ethereum Classic case as a protest against the Ethereum fork.
Other Important News From The Crypto World
- ️⚠️ Nomad Bridge Hack: Nomad Bridge, a bridge for moving crypto assets from one blockchain to another, suffered a hack that resulted in approximately $190 million US dollars being drained. This is due to an error that made it easy for hackers to change the transaction destination. Losses from hacking these cross-chain bridges have already reached $2 billion dollars by 2022.
- 🪙 Michael Saylor resigns as CEO of Microstrategy: Michael Saylor, well-known Bitcoin proponent and CEO of technology company Microstrategy, announced his resignation from his post. He stepped down as CEO and filled the positions of company executive officer and chairman of the Board of Directors. Saylor explained that his decision was made so that he could better influence policy and advocate for Bitcoin education.
- 🏦 BlackRock and Coinbase Cooperation BlackRock, the world’s largest asset management company ($8 trillion), is partnering with Coinbase to offer crypto asset management services to its clients. Bitcoin will be the first digital asset in Aladdin, BlackRock’s platform.
Cryptocurrency Performance Over The Past Week
5 Top Performing Cryptocurrency
- Quant (QNT) +21,65%
- Theta (THETA) +21,51%
- Chilliz (CHZ) +21,26%
- Near Protocol (NEAR) +19,71%
- Optimism (OP) +17,27%
5 Worst Performing Cryptocurrency
- Filecoin (FIL) -18,55%
- Convex (CVX) -6,41%
- STEPN (GMT) -4,58%
- Helium (HNT) -3%
- Kusama (KSM) -2,55%
References
- Jason Nelson, Solana, USDC Drained From Wallets in Attack, Decrypt, accessed on 8 August 2022.
- Samuel Haig, PoW Die-Hards Plan to Fork and Mine Their Own Ethereum Chains After The Merge, The Defiant, accessed on 8 August 2022.
- Jason Nelson, Crypto Bridge Nomad Exploited for $190M in ‘Frenzied Free-for-All’, Decrypt, accessed on 8 August 2022.
- Andrew Hayward, Bitcoin Fanatic Michael Saylor Steps Down as MicroStrategy CEO, Decrypt, accessed on 8 August 2022.
- Tarang Khaitan, BlackRock Partners With Coinbase To Offer Crypto To Institutional Investors, The Defiant, accessed on 8 August 2022.