
The price movement of Bitcoin and other cryptocurrencies is fluctuating. This is due to the deteriorating macroeconomic conditions in the world. The high inflation rate that is currently engulfing various countries has caused investors to be more careful in buying assets. The crypto industry has also been impacted by economic conditions. Bitcoin, Ethereum, and various other cryptocurrencies are experiencing a bear market where prices are in a downward trend. The Pintu team provides various information and news from the crypto world that can be useful for you. Read the full analysis here.
BTC and ETH Price Movement 6-12 June 2022
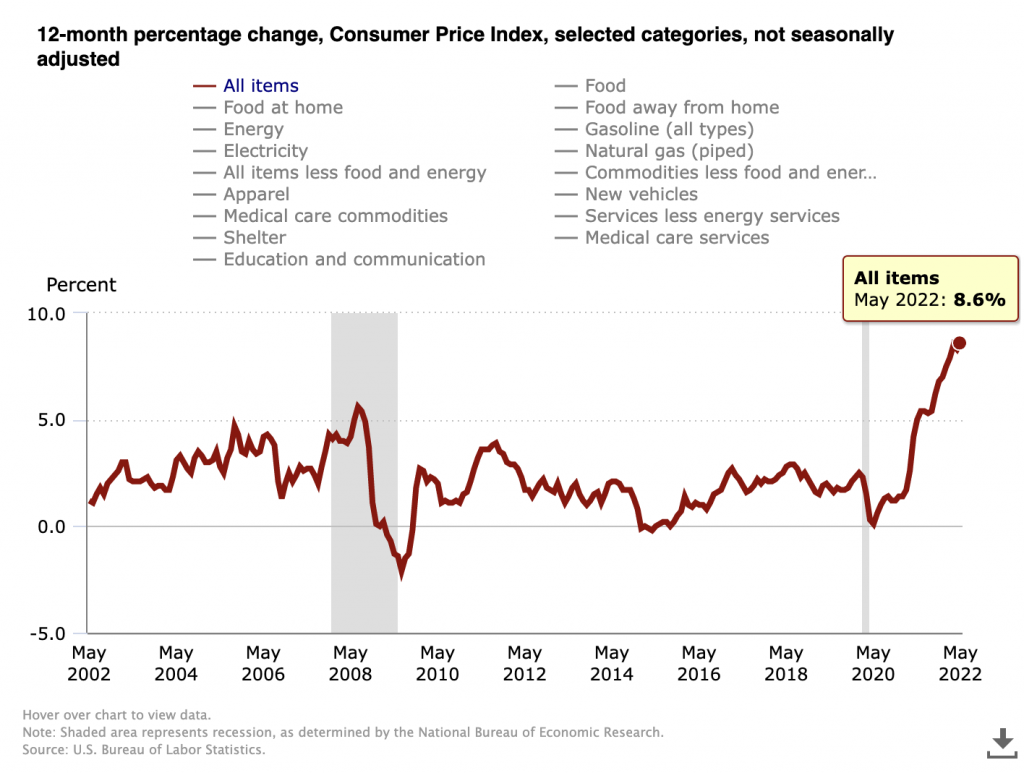
Inflation hit a 40-year high as May’s CPI stood at 8.6%, up from 8.3% in April and above the consensus level of 8.3%. On a month-to-month basis, the broadest gauge of inflation rose 1.0%, compared with 0.3% in April. The increase was broad-based, with housing, gasoline, and food indices the biggest contributors. The energy index was up 3.9% for the month with the gasoline index up 4.1% and the other major component indexes also increasing. The all-item index increased 8.6% for the 12-month period ended in May. This was the biggest 12-month gain since December 1981. The stock market reacted immediately after the CPI data was reported. The S&P was down nearly 3%, the Dow was down 2.7%, and the Nasdaq was down 3.5% by Friday.
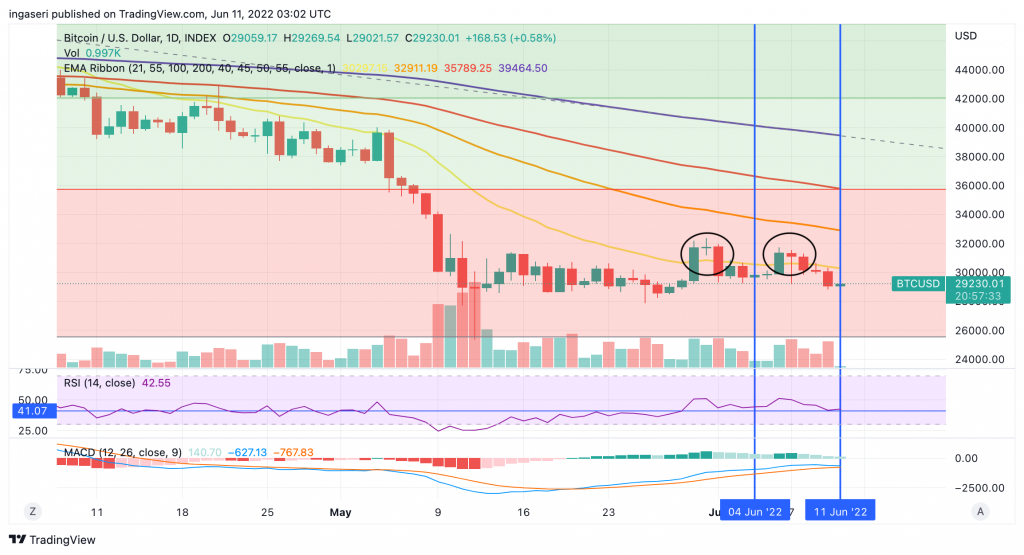
Over the past week, we have once again seen BTC fake out above the 21-day EMA line to then fall again, signaling the 21-day EMA line as a point of resistance. This has happened twice in the last two weeks (see chart above). Broadly speaking, we haven’t seen any significant movement as BTC hasn’t been able to break the $32K resistance level yet. So, BTC is still moving sideways.
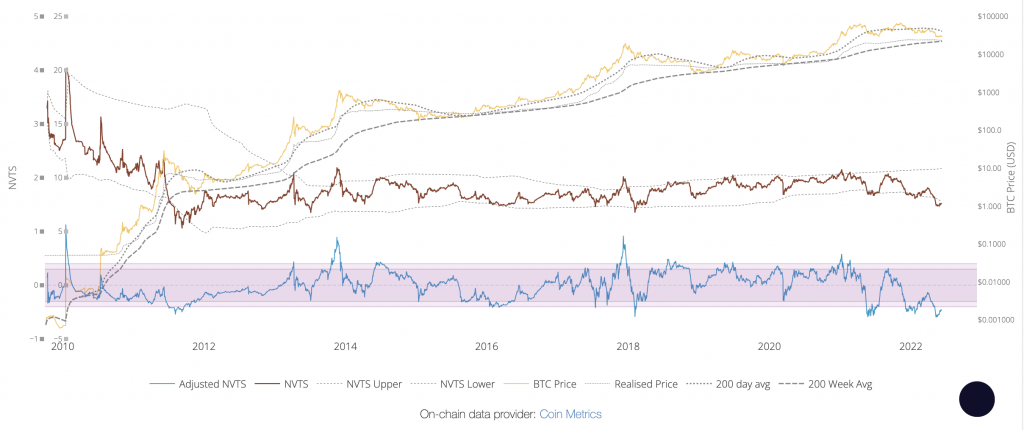
The NVT Ratio (Network Value To Transaction Ratio) is similar to the PE Ratio used in the equity market. When Bitcoin’s NVT is high, it indicates that Bitcoin’s valuation exceeds the total value of transactions on its payment network, this occurs when the network is in high growth and investors see it as a high-return investment, or alternatively when the price is in a bubble. Bitcoin NVT is calculated by dividing the Network Valuation (market cap) by the volume of USD sent via blockchain each day. Note that this is equivalent to the supply of bitcoin tokens divided by the daily value of BTC processed via the blockchain, NVT is technically the inverse monetary velocity.
NVT Signal (NVTS) differs from Standard NVT Ratio in that only Network Value is divided by Daily Transaction Value. NVTS is an NVT calculation that is then extrapolated using the moving average forward/backward to create a line.
Note that the NVT signal is below the low NVTS range, and the adjusted NVTS is also below the lower limit. This indicates that investors value Bitcoin at a discount, as the volume of on-chain transactions outpaces the growth of the market cap. Low NVTS values are historically a period for accumulating BTC and often coincide with the bottom of the market.
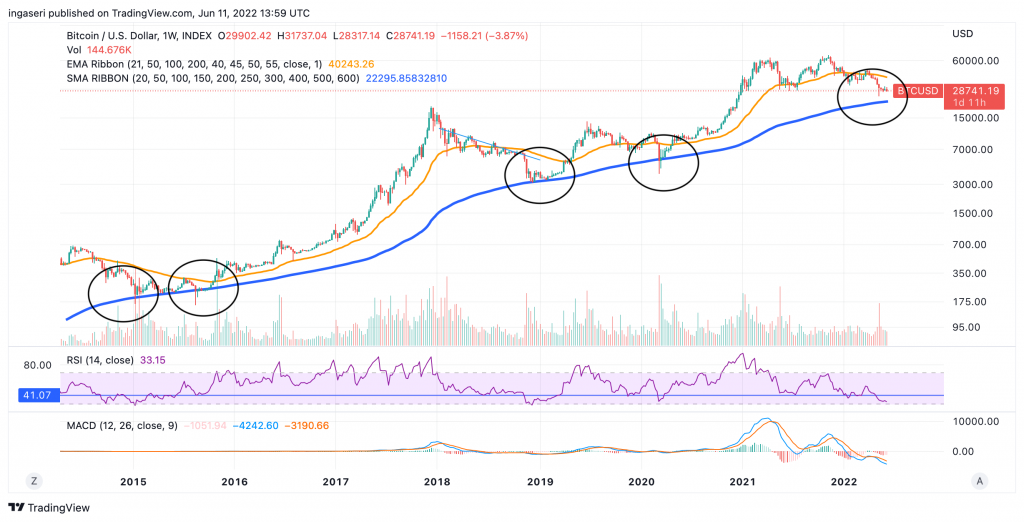
One interesting indicator to watch is the decline in BTC price to the 200-week MA line. In the last two times, BTC has touched this line, it has become a strong indicator of the biggest financial opportunity for Bitcoin. The 200-week moving average is currently at $22K US dollars. After touching the 200-week MA line, we can confirm an upward macro trend if BTC manages to break through the 50-week MA, forms a consolidation range above it, and manages to retest the support line.
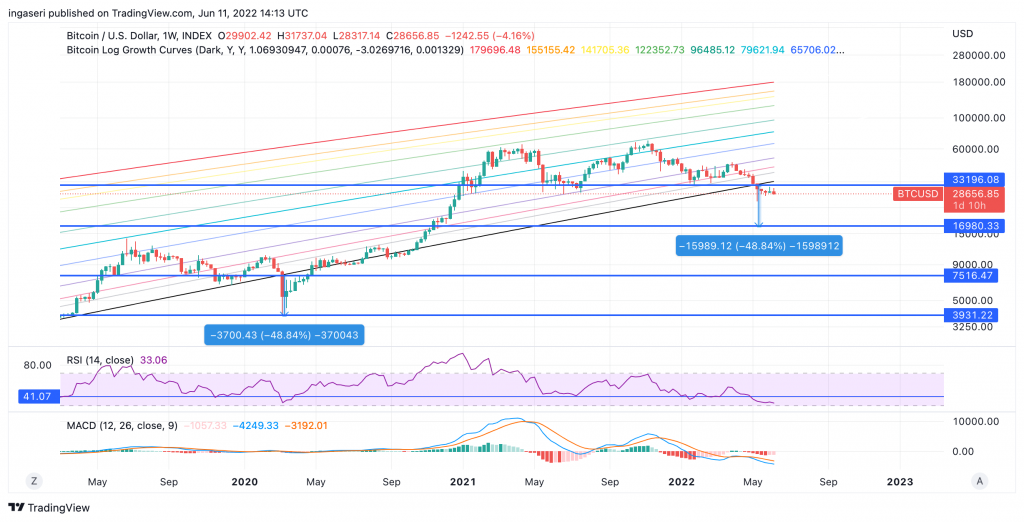
If we look at the logarithmic growth curve of BTC, the price of BTC had fallen from the lower band of the curve on the May 2020 downtrend. Currently, the same thing is happening. If we used the same percentage decline as May 2020, we would have experienced a 49% decline before finding a bottom. In today’s context, the point of support lies at the price of $17 thousand US dollars.
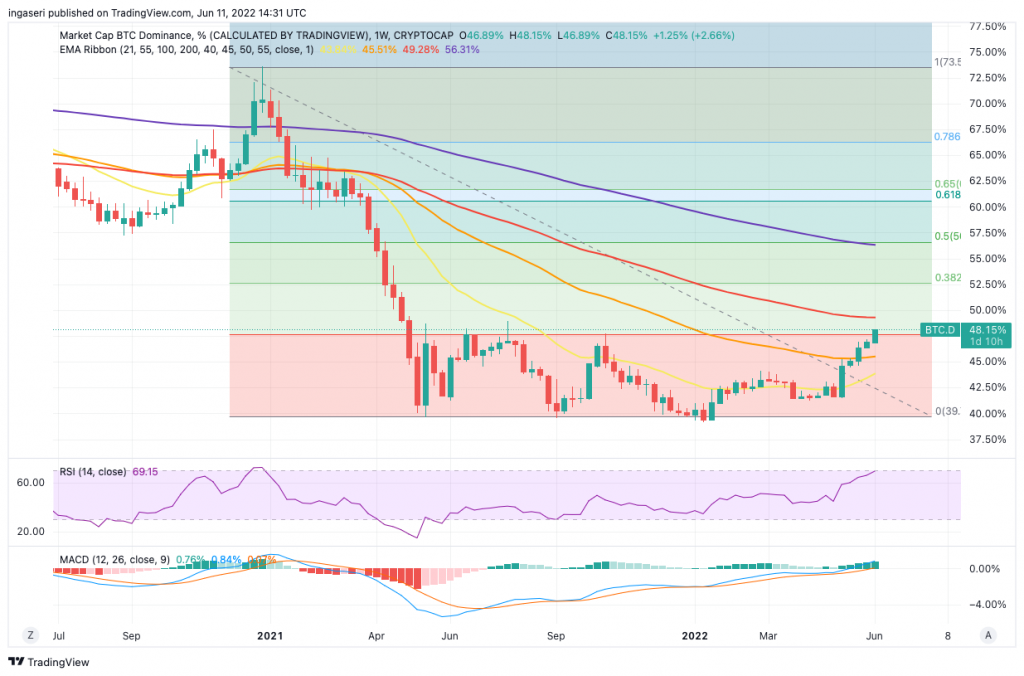
The Bitcoin Dominance indicator has continued to rise for the fifth week in a row. This week, there was a significant move because the dominance percentage broke through the 0.236 Fibonacci lines. This event is a strong signal that Bitcoin is stronger compared to other crypto assets. The resistance point is at the 100-week EMA, which is at the 50% dominance percentage.
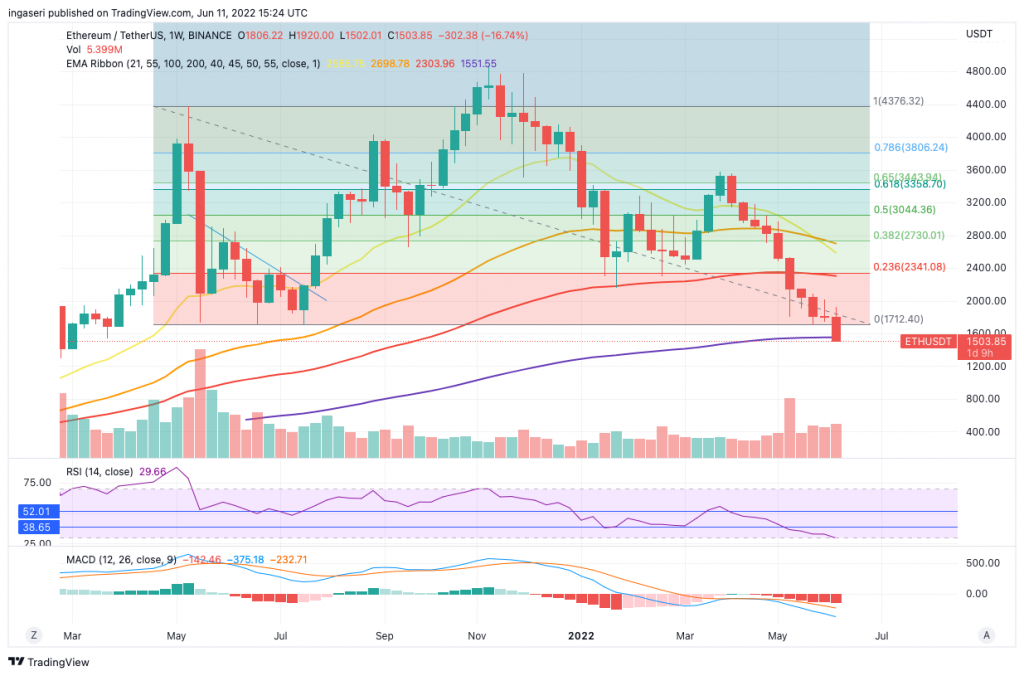
ETH has just made a significant move over the past week as it fell from the 200-week EMA support line.
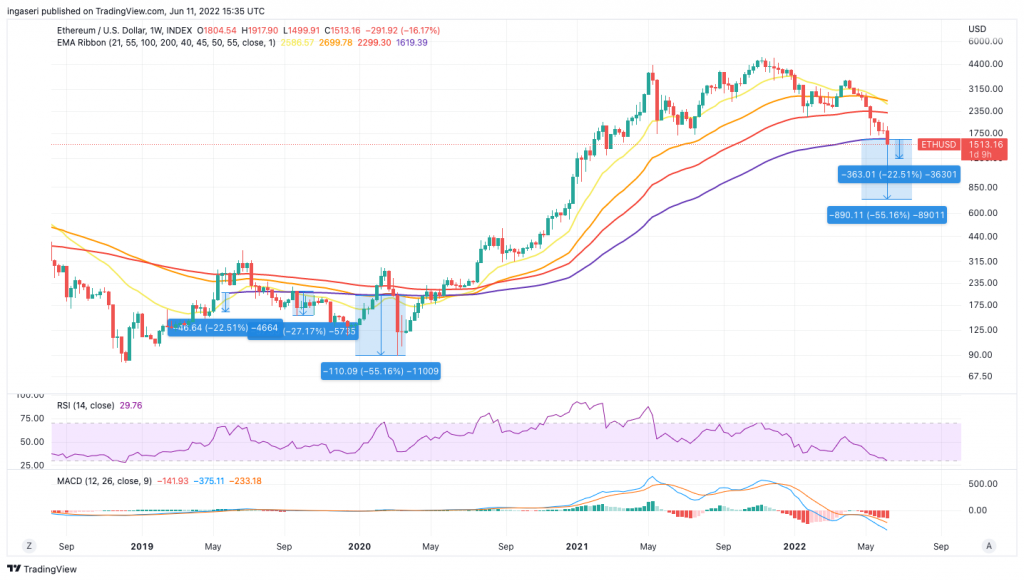
In the last two instances where ETH fell from the 200-week EMA line, it experienced a large price drop. It dropped by 22-55%. If we follow the previous scenario, the price of ETH could touch the $700-$1200 US dollar range.
In addition, the ETH funding ratio turned negative and the futures estimated leverage ratio rose significantly.
On-Chain Analysis
Reserves of all exchanges remain at their lowest level in 3 years. Spot Exchange reserves have been reduced including on Coinbase. Derivatives Exchange reserves remain at the same level. Whales and miners are still holding. The ratio of the flow of funds increases which indicates the intensity of trading on the exchange also increases. The amount of BTC transferred to the Derivatives Exchange is on a downward trend but is still high.
Positive sentiment is slightly stronger among futures investors, with increasing taker volume and positive funding levels. Open interest is at the same level as last week and the estimated value of the leverage ratio remains above the highest level seen in the previous week.
Both short-term and long-term holders of Bitcoin sell at a loss. The NUPL indicator indicates that the Bitcoin price is currently approaching an undervalued position.
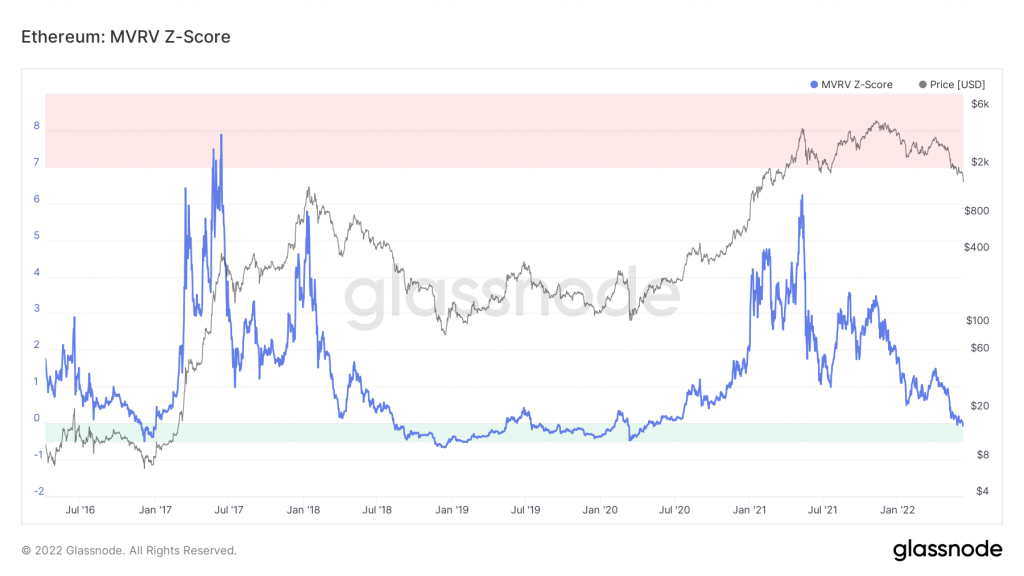
Note that the MVRV-Z Score for ETH has reached the green zone, which has historically been an indicator of an undervalued ETH price suitable for long-term investment/trade. The MVRV-Z score is used to assess when Ethereum is over/undervalued relative to its “fair value”. When the market value is significantly higher than the realized value, it indicates a market peak (red zone) and a market bottom (green zone). Technically, the MVRV Z-Score is defined as the ratio between the difference between market capitalization and realized capitalization, and the standard deviation of all previous market capitalization data, such as calculation (market capitalization–realized capitalization) / std (market capitalization).
Analysis Summary
- 📈 Inflation hit a 40-year high with May’s CPI reading at 8.6%, up from 8.3% in April. This figure is above the 8.3% consensus level. On an increasing monthly basis, the broadest gauge of inflation rose 1.0%, compared with 0.3% in April.
- ⚖️ BTC fake-out (gives a false signal) above the 21-day EMA line and then drops again, indicating the 21-day EMA line as a resistance point. There is no significant movement because BTC has not been able to break the $32 thousand US dollar resistance level. Therefore, BTC is still moving sideways. BTC’s NVTS value is in the low range. Historically low NVTS values are a period for accumulating BTC and often coincide with the bottom of the market.
- 🆘 One of the interesting indicators to watch is the decline in BTC price to the 200-week MA line. In the last two times, BTC has touched this line, it has become a strong indicator of the biggest financial opportunity for Bitcoin. In addition, the BTC logarithmic growth curve shows the BTC price had fallen from the lower limit of the curve in the May 2020 decline. At the moment, the same thing is happening. If we use the same percentage decline as May 2020, we will have a 49% decline before finding the bottom cap. In today’s context, the support point is the price of $17K US dollars.
- ⚠ ETH has just fallen from the support point of the 200-week EMA. In the last two instances where ETH fell from the 200-week EMA line, it experienced a large price drop. It dropped by 22-55%. If we follow the scenario that happened, the price of ETH could touch the range of $700-$1200 US dollars. On the other hand, the MVRV-Z Score for ETH has reached the green zone, historically indicating an undervalued ETH price and suitable for long-term investment/trade
News From the Altcoins World
- 🐵 ApeCoin stays on Ethereum: The community of ApeCoin holders votes on a proposal to stick with the Ethereum blockchain or not. Within 6 days, 56% of the voters voted to stick with Ethereum. This vote took place after the sale of the metaverse Otherdeeds land in which the total transaction gas cost was 60,235 ETH (US$170.8). Now, ApeCoin will try to use various L2s available on Ethereum such as Polygon, Optimism, and Arbitrum.
- 🤑 Illuvium virtual land sale: Illuvium has just completed its $72 million US dollar virtual land sale. This land auction takes place from 2-5 June. Illuvium managed to sell 19,969 plots of land. This sale was facilitated by Ethereum’s NFT L2 digital marketplace namely Immutable X.
Other Important News From The Crypto World
- 🔍 SEC Investigation of Binance: The Securities and Exchange Commission (SEC), a monetary agency of the US government, is suspected of conducting an investigation into Binance’s native cryptocurrency, BNB. The SEC is investigating whether BNB is part of unlisted security.
- 💵 Do Kwon and Terra: An allegation against Do Kwon and Terra has just surfaced. A Twitter account, @FatmanTerra, made a series of tweets explaining how Do Kwon and his team withdrew $2.7 billion US dollars. The withdrawal is said to have occurred several months before the collapse of the UST dollar and LUNA tokens. However, Do Kwon denied and called the accusations false.
- ☠️ Optimism Attack: On June 8th, Optimism announced that an attack had occurred which resulted in the loss of 20 million OP tokens. This happened when Optimism sent 20 million OPs to an address belonging to Wintermute, a market maker organization that aims to provide liquidity at the launch of the OP token. However, this address turned out to be inaccessible and an attacker managed to retrieve all the OP tokens before Wintermute could recover them. Wintermute accepts that they made a mistake and will buy the lost OP tokens. However, a plot twist occurred as the attacker returned the 18 million OP tokens and kept the remaining 2 million as a bounty.
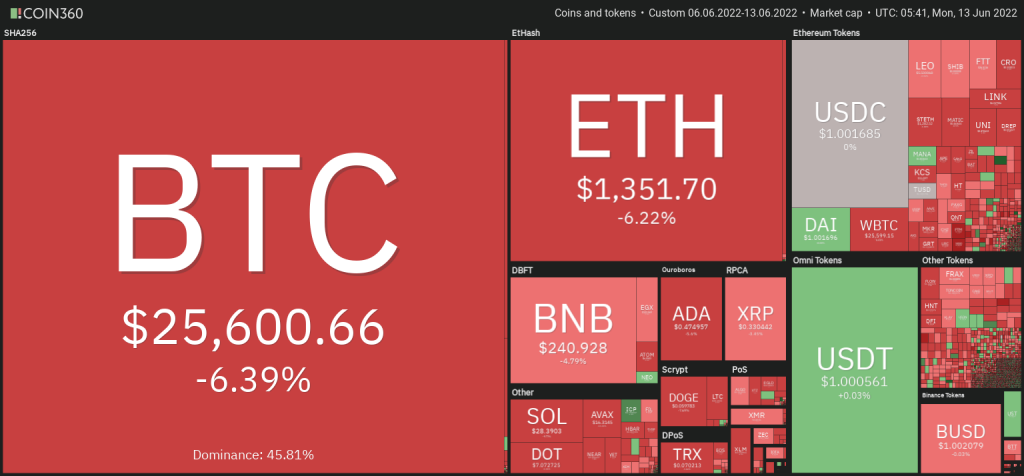
Cryptocurrency Performance Over The Past Week
References
- Samuel Haig, ApeCoin Community Commits to Ethereum to ‘Properly Scale’, The Defiant, accessed on 13 June 2022.
- Samuel Haig, Illuvium Raises $72M From Land Sale Despite GameFi Bear Market, The Defiant, accessed on 13 June 2022.
- Nelson Wang, Binance CEO Changpeng Zhao Questions SEC Investigation into BNB, Coin Desk, accessed on 13 June 2022.
- Arijit Sarkar, Do Kwon dismisses allegation of cashing out $2.7B from LUNA, UST, Coin Telegraph, accessed on 13 June 2022.
- Aleksandar Gilbert, BREAKING: Optimism Exploiter Returns 90% Of Stolen Tokens, The Defiant, accessed on 13 June 2022.