
The Fed plans to maintain its policy of raising interest rates to curb US inflation. How will this decision impact the crypto market?
Pintu’s trader team has collected various important data about the price movements of the crypto asset market over the past week, which is summarized in the Market Analysis below. Kindly note that all information from this Market Analysis is for educational and informational purposes only, and not financial advice.
Market Analysis Summary
- 🏛 The central bank of the United States, the Federal Reserve, announced that interest rates must continue to rise to prevent inflation from becoming a permanent condition in the United States economy.
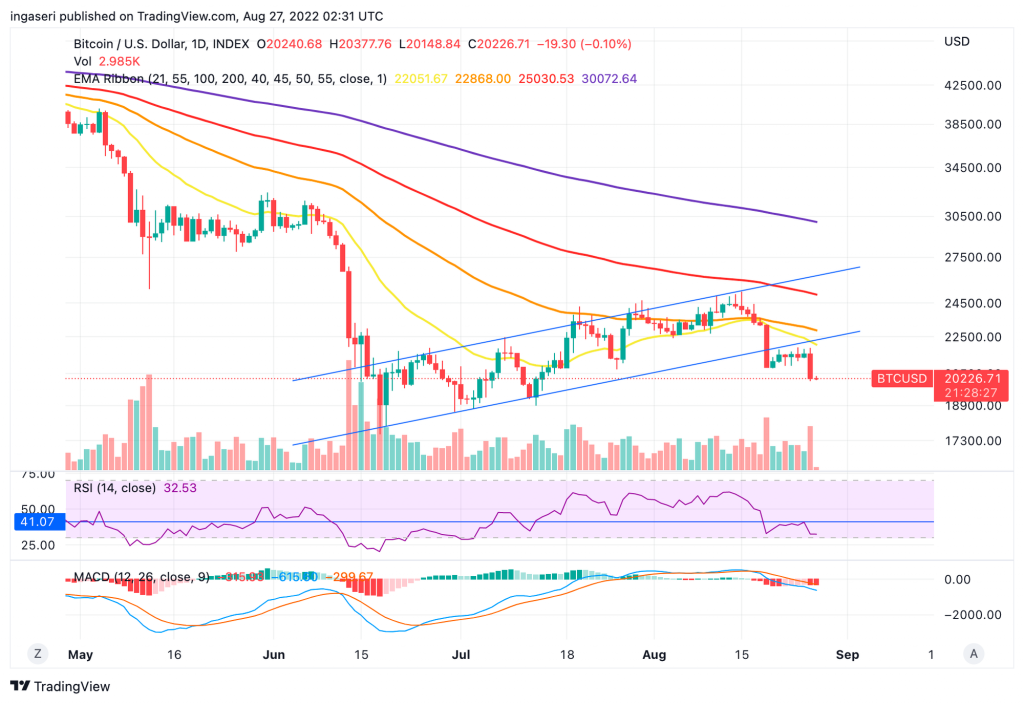
- 📉 BTC fell close to 6% and broke out of the 21-day EMA support line after the Fed’s announcement.
- 📊 ETH has broken out of the bear flag channel on the daily chart, and on the weekly chart, ETH is currently at the 0.236 Fibonacci support line. 1,500 US dollars is a price point that seems to be a strong support for ETH.
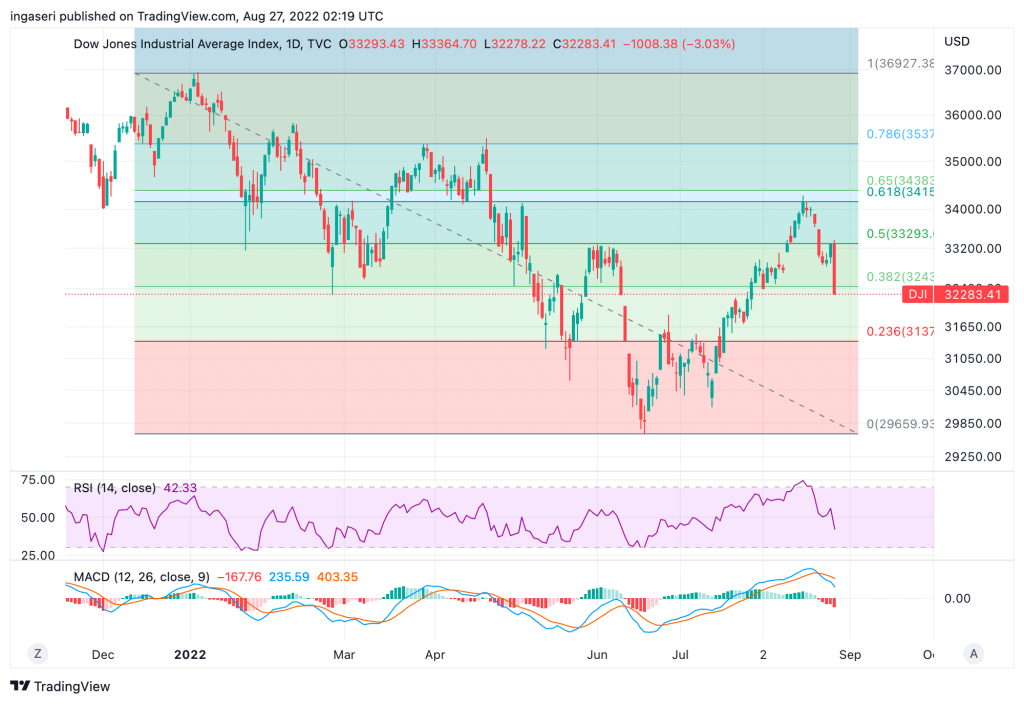
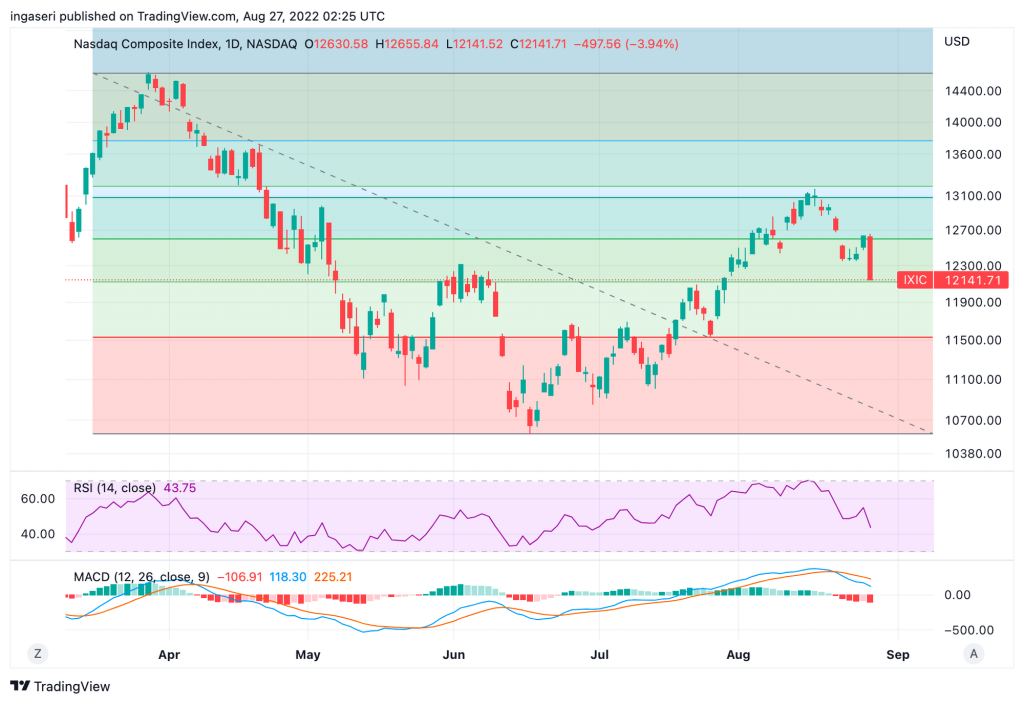
The Fed chairman, Jerome Powell, announced on Friday that interest must continue to be raised in order to stop inflation from becoming permanent aspect of the US economy. This statement has caused the market to tumble, with Dow erasing more than 1000 point and Nasdaq falling close to 4%. The interest rate has been raised to a range of 2.25-2.5% since March. Powell said, “Reducing inflation is likely to require a sustainable period of below-trend growth.”
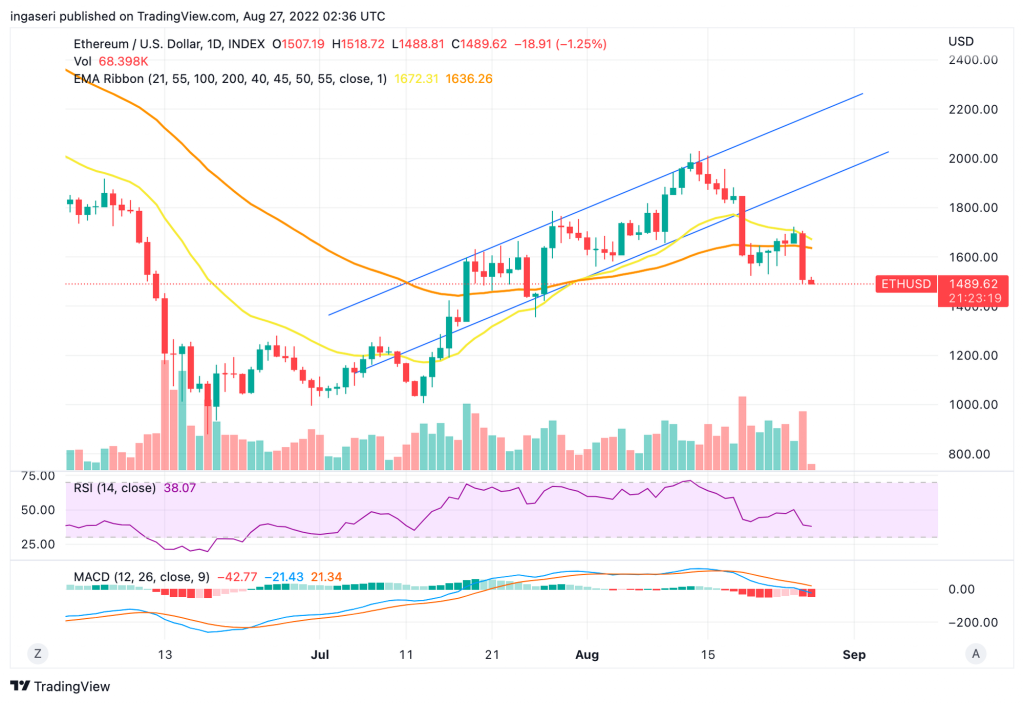
The crypto market plunged as well, with BTC falling close to 6% as the equities market retracing. Notice in the chart below, we see that upon breaking down and out of the 21 days EMA support line, we plunged down and not able to retrieve the particular line as support.
As seen, we have broken out of the bear flag channel that we have been discussing since couple of weeks ago. Moreover, the bottom support of the channel has become a resistance for the price action.
Over the past week, we have broken out of the bear flag channel of ETH daily chart. The upward momentum has been tremendous over the last couple of weeks due to the ETH merge event. Now we can see that we have found the 21 days EMA to be a resistance line after unsuccessfully trying to break out of it on the 25th August.
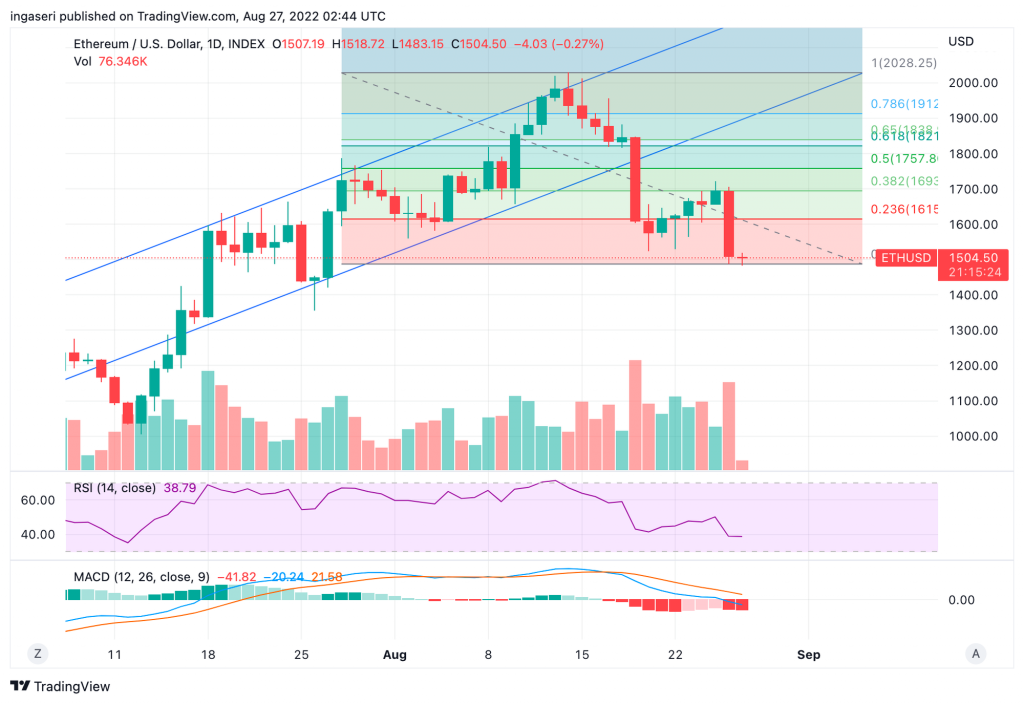
On the longer term chart, we are currently on the 0.236 Fibonacci support line. This is a fragile support, should we close below this support line, we might find ETH’s price action to worsen and have more volatility. Nearest support at US$1.500.
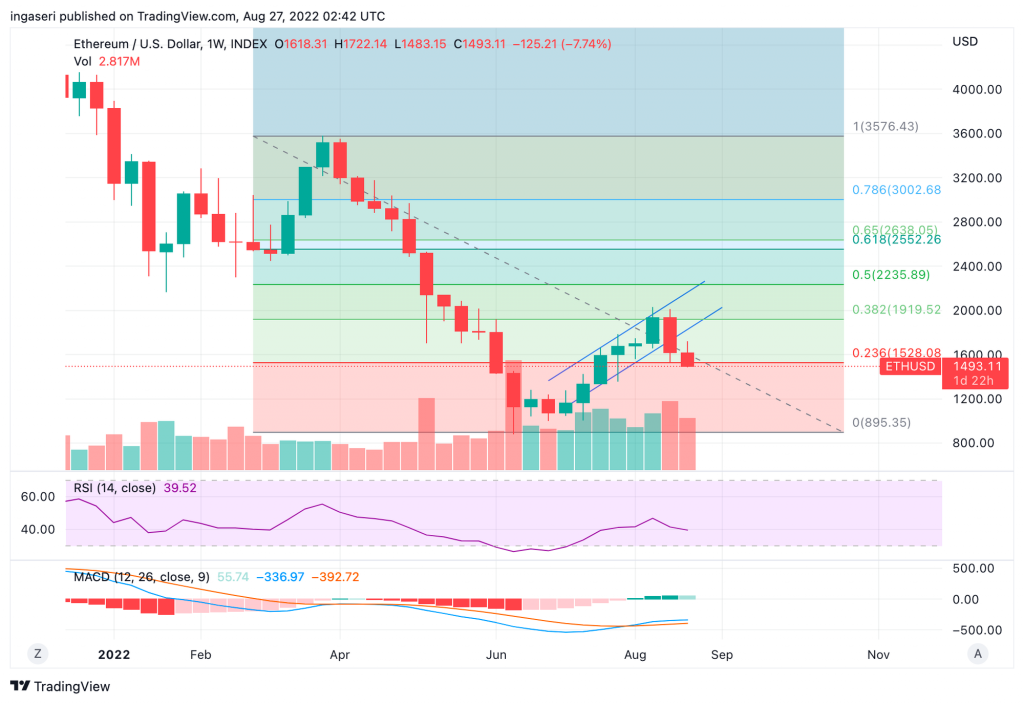
The daily chart seems to agree that 1500 price for ETH seems to be a strong support.
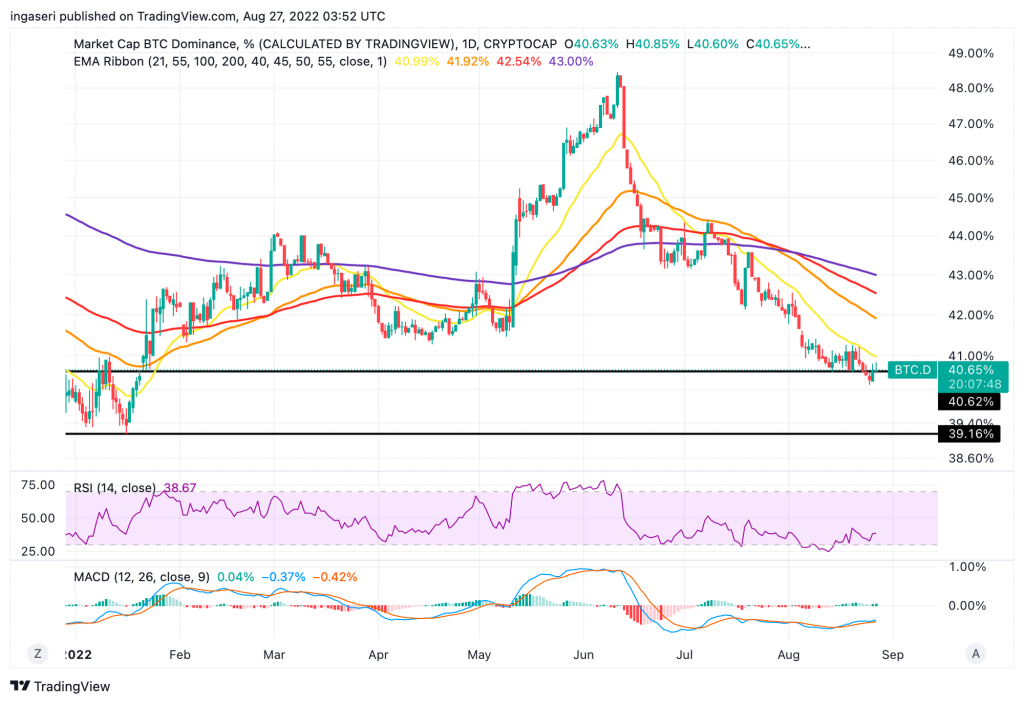
BTC Dominance has risen up to above the resistance line of 40% after the effects on the sell on news event for ETH. The value of 40% has always been a strong support, hence should we maintain this line, expect BTC Dominance to rise even further. Conversely, should we break down this area of dominance, we should see a more deeper fall.
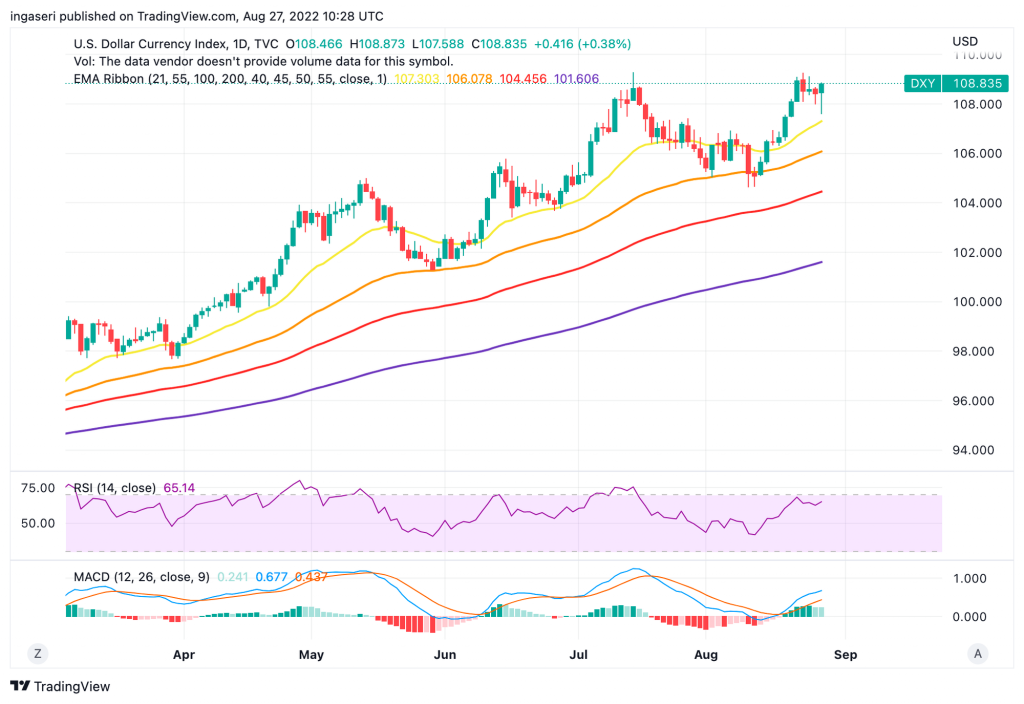
The dollar index is retracing back towards the 21 weeks EMA support line, but we hold support, should we fall below the 21 weeks support line, the next support would be at the value of 106 (55 weeks EMA).

The NUPL (Net unrealized on-chain Profit/Loss) has once again gone into the capitulation area (red zone) since early this week. Historically, attaining this zone has always been a good indicator to accumulate BTC.

On-Chain Analysis
- Exchange: Net deposits on exchanges are high compared to the 7-day average. Higher deposits can be interpreted as higher selling pressure.
- Miners: Miners’ are selling holdings in a moderate range compared to its one-year average. Miner’s revenue is in a moderate range, compared to its one-year average.
- On-chain: More investors are selling at a loss. In the middle of a bear market, it can indicate a market bottom. Long term holders’ movement in the last 7days were lower than the average. They have a motive to hold their coins. Investors are in a capitulation phase where they are currently facing unrealized losses. It indicates the decreasing motive to realize loss which leads to a decrease in sell pressure.
- Derivatives: Short position traders are dominant and are willing to pay long traders. Buying sentiment is dominant in the derivatives market. More buy orders are filled by takers. As open interest decreases, it indicates investors are closing futures positions, and the possibility of trend reversals. In turn, this might trigger the possibility of long/short-squeeze caused by sudden price movement or vice versa.
Altcoins News
- Ava Labs CEO denies CryptoLeaks claims to be a ‘nonsense conspiracy theory’: Ava Labs CEO Emin Gün Sirer has dismissed accusations from CryptoLeaks that his company uses litigation to “harm” competitors and deceive regulators, labeling it a “conspiracy theory” nonsense.” Quoted from Cointelegraph, CryptoLeaks previously accused the company of forming a “secret pact” with US law firm Roche Freedman to use the “gangster style” of the American legal system to “attack and harm crypto organizations.”
- Compound III Launched With Emphasis On Simplicity: Compound Finance, one of DeFi’s oldest lending protocols with a total locked-in value (TVL) of US$2.72 billion, launched Compound III on August 25 following a successful governance vote. The biggest change in the new iteration of Compound is that instead of being able to borrow any asset from the pooled asset pool, users will only be able to borrow one “base asset”.
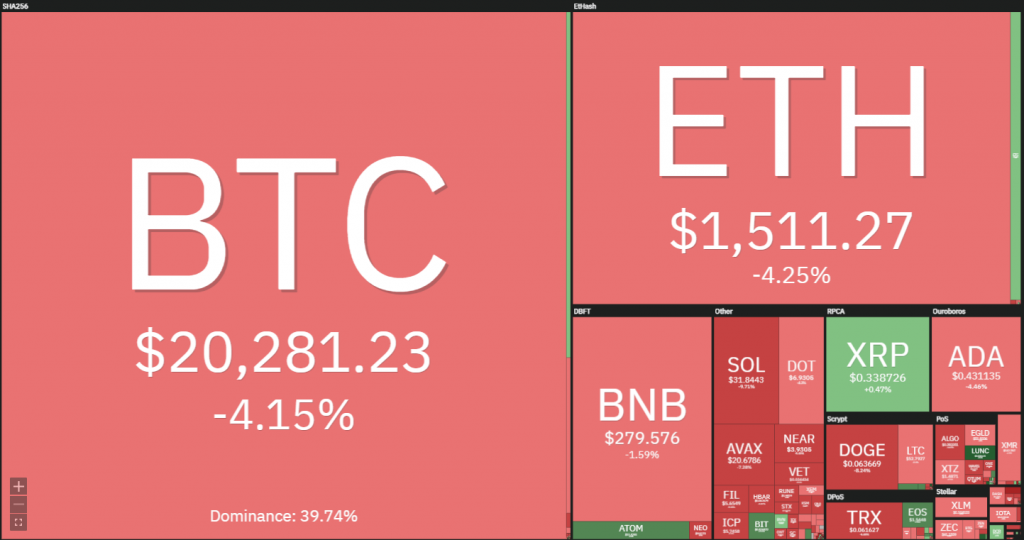
Crypto Asset Performance Over the Last Week
References
- Brayden Lindrea, Ava Labs CEO denies CryptoLeaks’ claims as ‘conspiracy theory nonsense’, Cointelegraph, accessed on August 29, 2022
- Owen Fernau, Compound III Launches With Emphasis On Simplicity, The Defiant, accessed on August 29, 2022
- Marcel Pechman, Hawkish Fed comments and Bitcoin derivatives data point to further BTC downside, Cointelegraph, accessed on August 29, 2022