The number of continuing jobless claims in the US has increased again. This could be seen as a sign that the Federal Reserve’s aggressive actions are having an effect, as the labor market expands. In the cryptocurrency market, both BTC and ETH have failed to pass the 21-day exponential moving average resistance level. For more detailed analysis, read the full analysis below.
Pintu’s trader team has collected various important data about macroeconomic analysis and crypto market movement over the past week which is summarized in this Market Analysis. However, you should note that all information in this Market Analysis is for educational purposes, not financial advice.
Article Summary
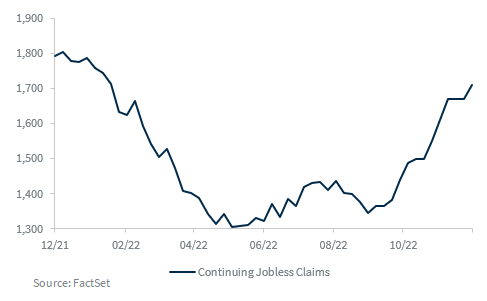
- 📈 The number of continuing jobless claims has increased by 41,000 last week to 1.71 million, the highest level in 10 months.
- ⚠ Macro outlook for 2023: a recession is increasingly likely in 2023.
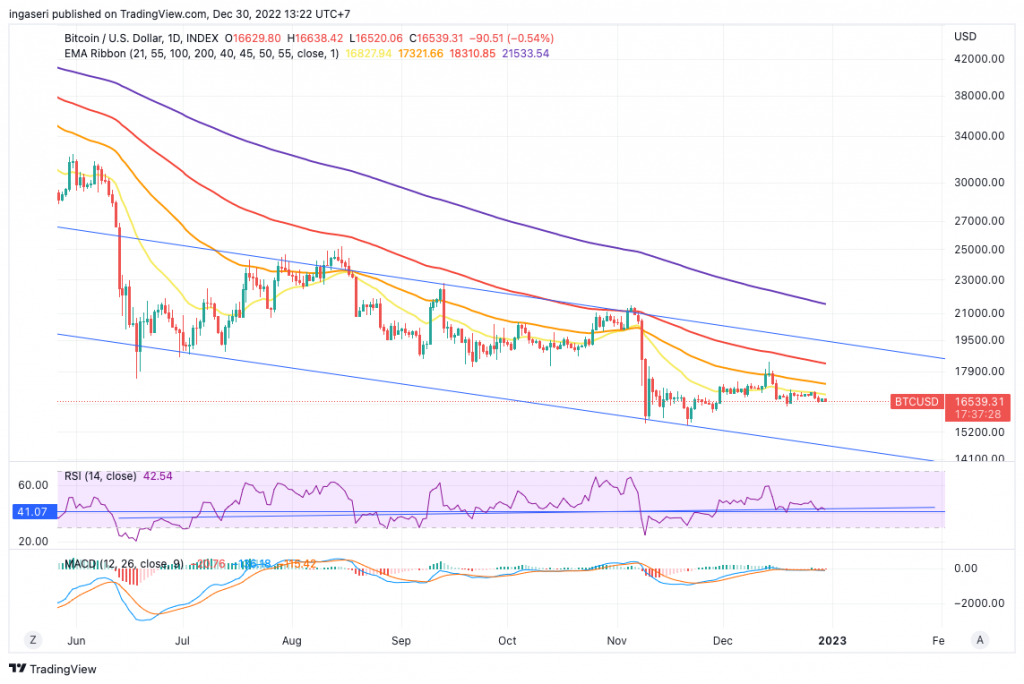
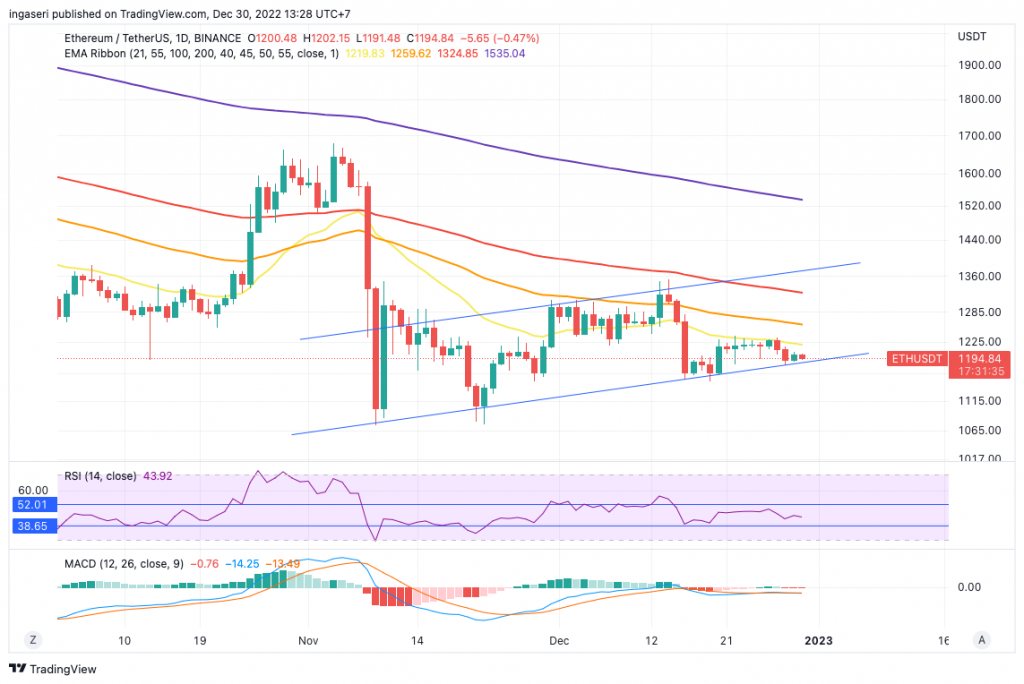
- 📉 BTC trying to make its way out of the 21 days EMA resistance line but was knocked down. ETH has seen itself get rejected from the 21 days EMA.
- ❗ BTC is still at risk for more downturn towards the 11-14k range looking at previous backtested data.
Macroeconomic Analysis
The United States (US) labor market is loosening. The number of continuing jobless claims has increased by 41,000 last week to 1.71 million, the highest level in 10 months. We have yet to see the full effect of the layoffs, especially in the tech sector as some of the layoffs could be taking effect later as employees might be kept on the payroll for some time after the announcement.
According to this data, the labor market is loosening, which is great news for the Fed. This indicates that the Fed’s aggressive stance to raise interest rates is showing results. Thus, the Fed will no longer need to take aggressive monetary policy steps in the future.
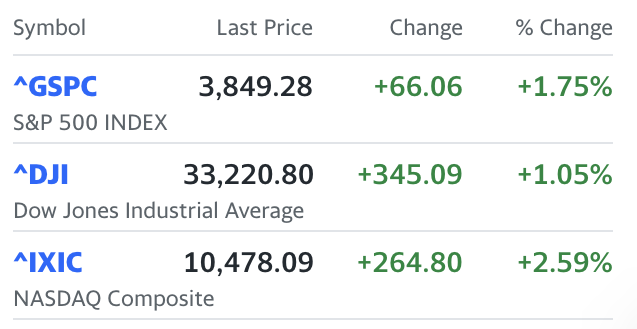
The three main indexes finished sharply higher towards the end of the week as the jobless claims data showed the number of workers receiving benefits has climbed to the highest level since February, a strong indicator that the Fed’s interest rate hike is effective and slowing inflation and growth.
Although the U.S. is not in recession right now, a recession is increasingly likely in 2023. There is a weak trajectory for growth. There are several factors putting the economy on unsure footing for 2023, including a deteriorating housing market, sluggish inflation, and an aggressive Fed. Fortunately, markets may have priced in many near-term recession risks, and the Fed will likely slow down its rate hike pace going forward.
Bitcoin Price Analysis
BTC started the week trying to make its way out of the 21 days EMA resistance line but was knocked down. We have been resisted to be under this line since 2 weeks ago, and we’ve been trying multiple times since then to overcome this resistance. Zooming out, we are still within the falling wedge channel. It will be no surprise should we fell below the 15,000 level, notice that the bottom range of the channel is at 14,500. Considering the overall market sentiment and the bearish price action signs, another cascade are probable.
Ethereum Price Analysis
ETH has seen itself get rejected from the 21 days EMA as well and fall towards the bottom edge of the channel. Should this price action continues within the price action, we might see a short term bounce to the upside.
2022 Recap
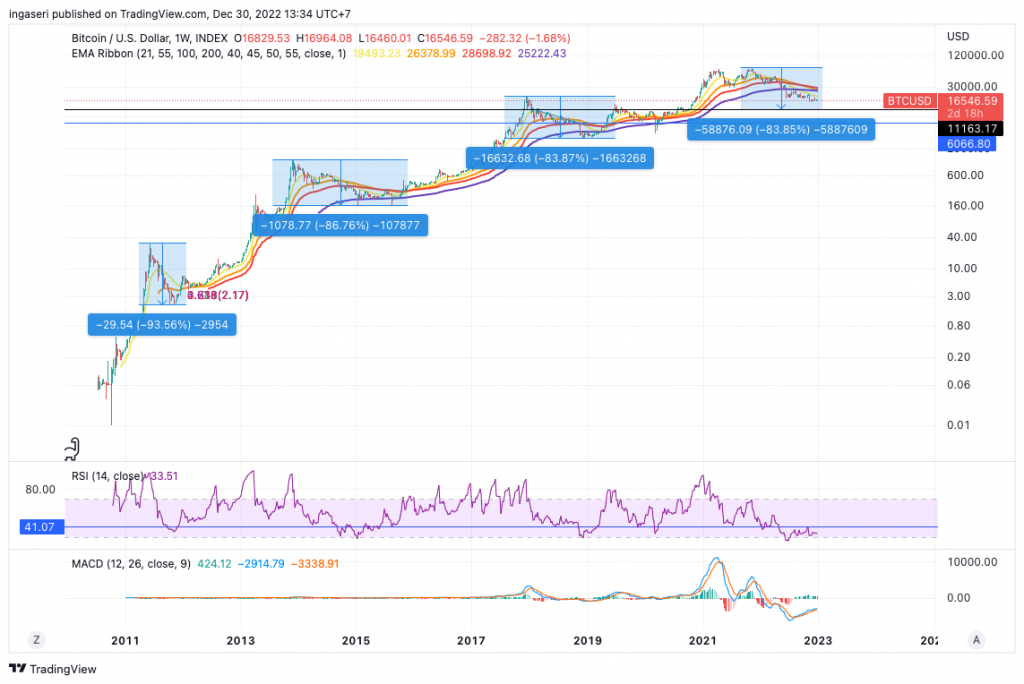
Recapping the general sentiment given early this year, the bear has overcome the bulls and our earlier forecast stated that BTC might see a downtrend till the 11-14k. This analysis is still valid and we might see encounter further worsening of BTC’s price should we enter a hard landing into 2023’s recession. Although recent economic data has indicated a reversal sign, we have yet to see a continuous and consistent downtrend of inflation and growth. BTC is still at risk for more downturn towards the 11-14k range looking at previous backtested data.
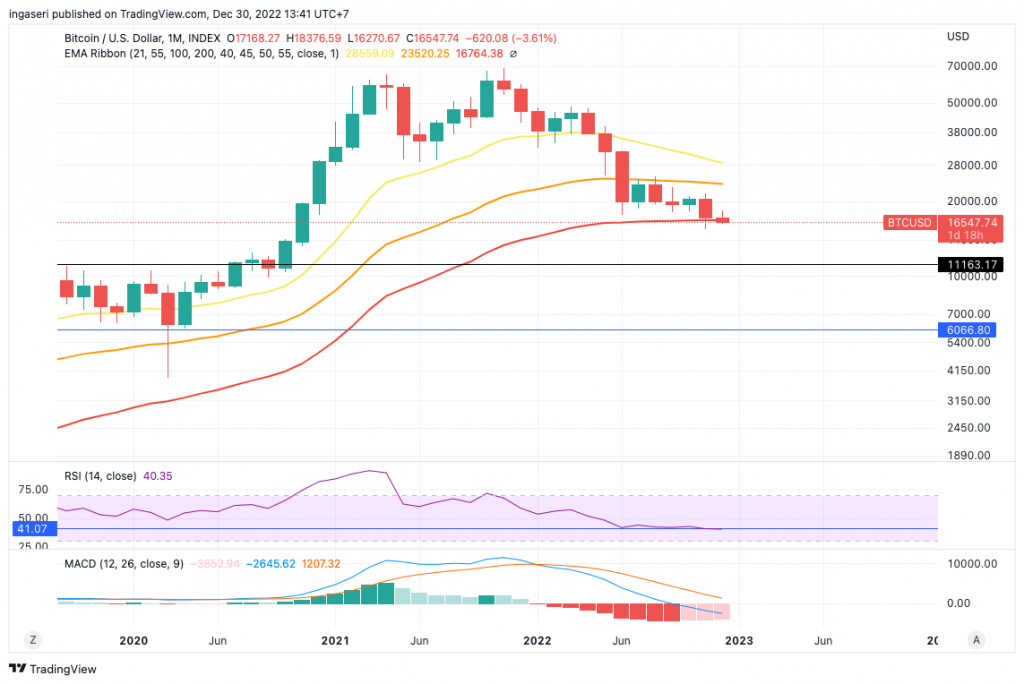
As we close the monthly candle of December, closing below 16,500 would mean we would close below the 100 month EMA for the first time in the history of BTC.
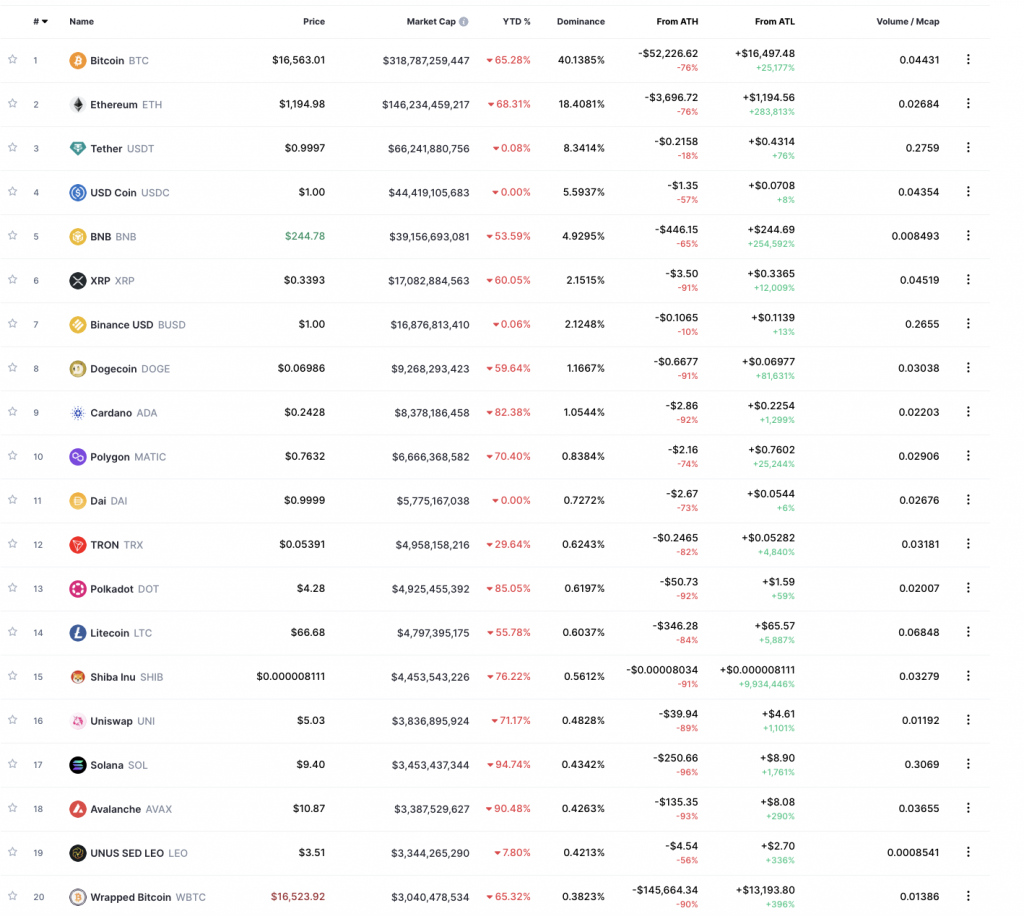
As we recap 2022 coin’s performance, we see that only BTC,ETH, Polygon and exchange tokens have slightly better performance that the rest of the alts. This shows the full impact of macro economic conditions throughout 2022 and the multiple routs within the crypto space.
On-Chain Analysis
Let’s go through several on-chain indicators that shows how underperformed BTC and the whole crypto market.
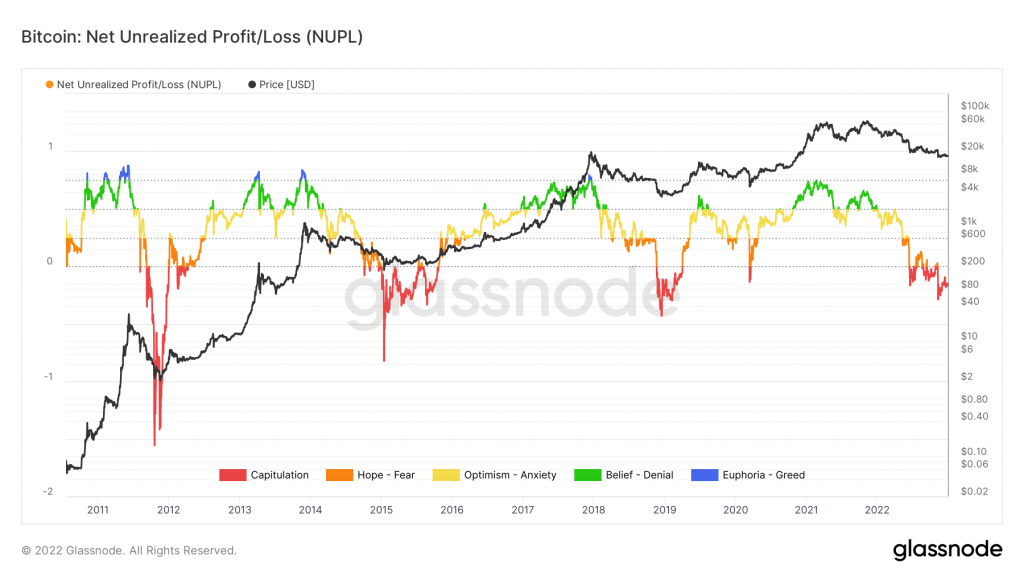
First, BTC’s NUPL, we can see that we are still in capitulation mode. Net Unrealized Profit/Loss is the difference between Relative Unrealized Profit and Relative Unrealized Loss
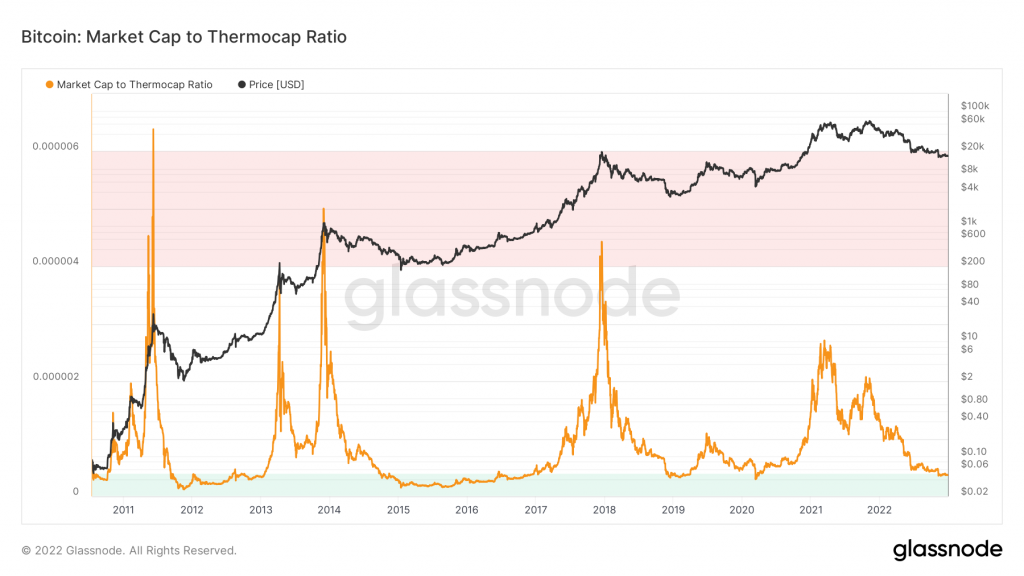
Second, BTC’s market cap to thermocap ratio. This indicator can be used to assess if the asset’s price is currently trading at a premium with respect to the total security spent by miners. Historically, values below 0.0000004 (highlighted in green) marked market cycle bottoms. Conversely, values above 0.000004 (highlighted in red) marked cycle tops. Based on the foregoing indicator, the current BTC price is undervalued when compared to the price back in July 2021.
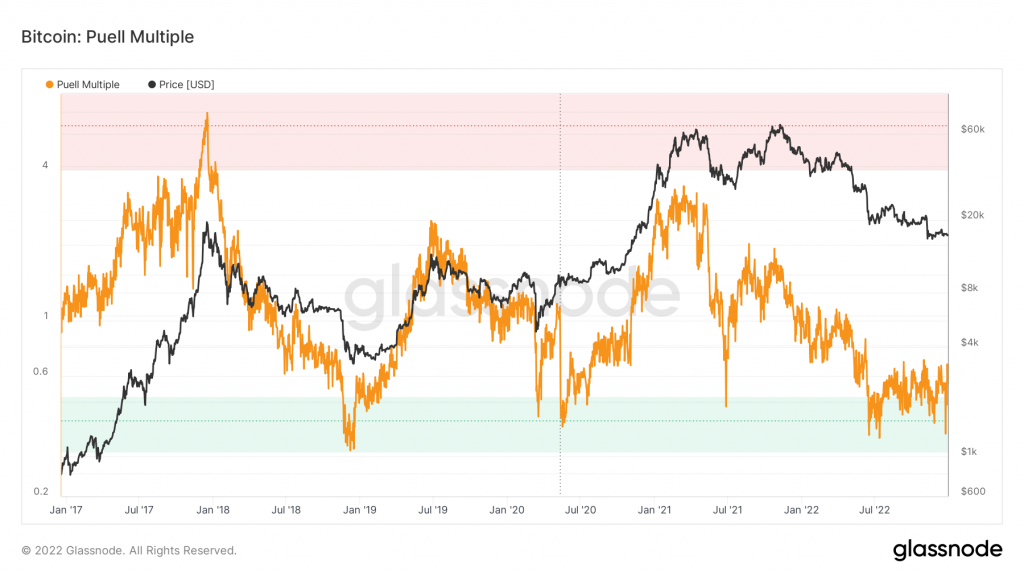
Third, The Puell multiple looks at the supply side of Bitcoin’s economy – bitcoin miners and their revenue. It explores market cycles from a mining revenue perspective. Bitcoin miners are sometimes referred to as compulsory sellers due to their need to cover fixed costs of mining hardware in a market where the price is extremely volatile. The revenue they generate can therefore influence price over time.
The chart below highlights periods where the value of Bitcoin issued on a daily basis has historically been extremely low (Puell Multiple entering green box), which produced outsized returns for Bitcoin investors who bought Bitcoin here. It also shows periods where the daily issuance value was extremely high (Puell Multiple entering red box), providing advantageous profit-taking for Bitcoin investors who sold here. Based on this, the current price can be considered too low and may need to bounce (the indicator is in the green zone).
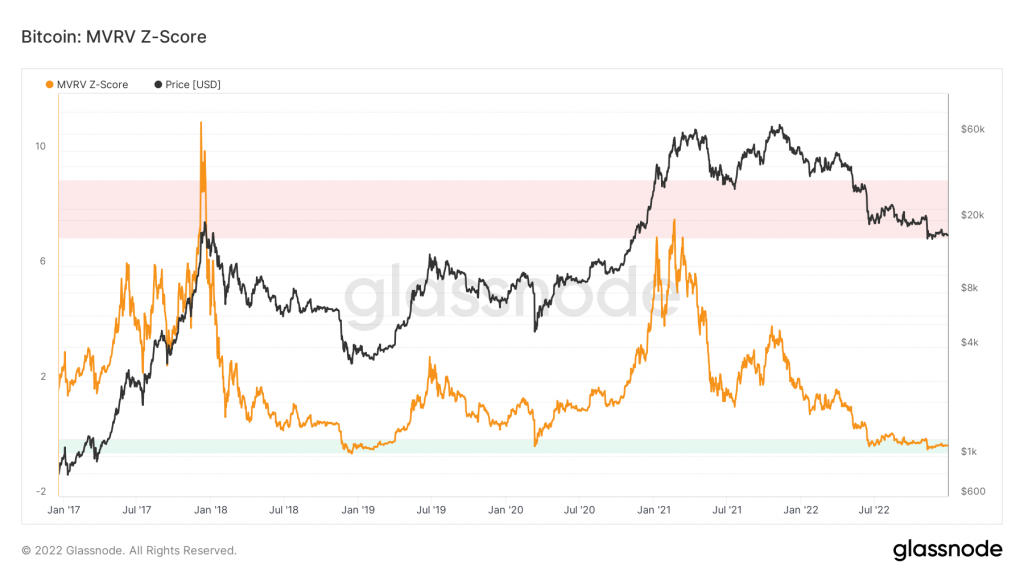
Last but not least, The MVRV Z-Score is used to assess when Bitcoin is over/undervalued relative to its “fair value”. When market value is significantly higher than realized value, it has historically indicated a market top (red zone), while the opposite has indicated market bottoms (green zone). Technically, MVRV Z-Score is defined as the ratio between the difference of market cap and realized cap, and the standard deviation of all historical market cap data. Currently, the score is in the period where market value is far below its realized value, historically buying bitcoin during these times produced outsized returns.
On-Chain Analysis:
📊 Exchange: As the exchange reserve continues to rise, it indicates higher selling pressure. Net deposits on exchanges are low compared to the 7-day average. Lower deposits can be interpreted as lower selling pressure.
💻 Miners: Miners’ are selling holdings in a moderate range compared to its one-year average. Miner’s revenue is in a moderate range, compared to its one-year average.
🔗 On-chain: More investors are selling at a loss. In the middle of a bear market, it can indicate a market bottom. Long term holders’ movement in the last 7days were lower than the average. They have a motive to hold their coins. Investors are in a Capitulation phase where they are currently facing unrealized losses. It indicates the decreasing motive to realize loss which leads to a decrease in sell pressure.
🏦Derivatives: Short position traders are dominant and are willing to pay long traders. Buying sentiment is dominant in the derivatives market. More buy orders are filled by takers. As open interest increases, it indicates more liquidity, volatility, and attention are coming into the derivative market. The increasing trend in OI could support the current ongoing price trend.
🔀 Technicals: RSI indicates a Neutral condition. Stochastic indicates a Neutral condition where the current price is in a moderate location between the highest-lowest range of the last 2 weeks.
Altcoin News
- 1inch (1INCH) launches Fusion upgrade on 1inch Swap Engine. This Fusion upgrade aims to increase security, while adding an extra layer protecting users from sandwich attacks. In addition, the Fusion update also makes swaps on 1Inch dramatically more cost-efficient, as users won’t have to pay network fees. As a result, the profitability of Swap Engine has also increased. This update also includes network improvements, such as updated staking contracts and tokenomics.
- Two of Solana’s (SOL) top NFT project have migrated. After having a challenging year due to the impact of FTX, Solana now also has to lose two of its top NFT projects. DeGods and y00ts announced they calling it quits on Solana this week, with planned migrations to Ethereum mainnet and Polygon respectively.
More News from Crypto World in the Last Week
- The 3Commas trading platform was hacked, and $22 million worth of crypto assets were stolen. This hack was carried out through compromised Application Programming Interface (API) keys from 3Commas. The announcement came after a tweet by ZachXBT, who said he received a message from an anonymous user with around 100,000 API keys belonging to 3Commas users. Initially, 3Commas denied this incident and argued it was due to a phishing attack. However, on Wednesday (28/12/22), 3Commas finally admitted that there was a hack.
- MicroStrategy added 2,500 Bitcoins for US$ 45 million. However, The ****software company also sold 704 BTC for US$ 11.8 million on the premise that a loss on the transaction would offset previous capital gains. The sale last week marks the first time MicroStrategy has sold bitcoin since it began acquiring the cryptocurrency in 2020. Currently, MicroStrategy has total holdings up to 132,500 BTC.
- MetaMask Swap now supports Arbitrum and Optimism networks. The Swap feature first launched in late 2020 with a service that allows users to exchange tokens in their wallets without connecting them to a DEX. Most recently, MetaMask Swap already supports exchanges on Arbitrum and Optimism’s layer-2 networks. Since its launch, MetaMask Swap has recorded a cumulative volume of US$24 billion with more than 1.5 million users.
Cryptocurrencies Market Price Over the Past Week
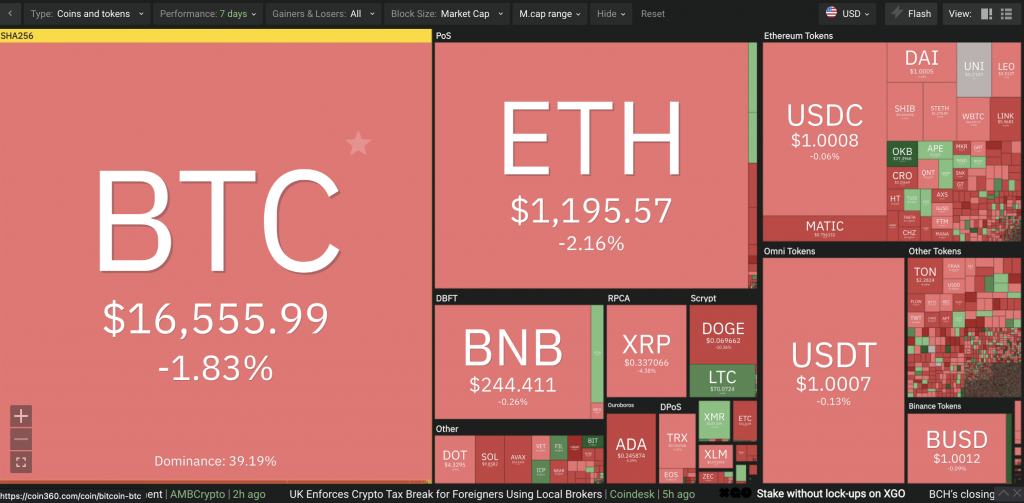
Cryptocurrencies With the Best Performance
- Lido DAO (LDO) +5.98%
- Litecoin (LTC) +5.87%
- Algorand (ALGO) +5.44%
- Filecoin (FIL) +5.14%
Cryptocurrencies With the Worst Performance
- Hedera (HBAR) -14.76%
- Solana (SOL) 13.48%
- Flow (FLOW) -13.03%
- The Sandbox (SAND) -12.48%
Reference
Arijit Sarkar, 1inch launches Fusion upgrade to improve swap security and profitability, Coin Telegraph, accessed on 1 January 2023
Bankless, Solana is in trouble. Bankless Newsletter, accessed on 1 January 2023.
Mat Di Salvo, 3Commas Admits It Was Source of API Leak That Led to Hacks, DeCrypt, accessed on 1 January 2023
Oliver Knight, MicroStrategy Added 2,500 Bitcoins for $45M in Last 2 Months, Coin Base, accessed on 1 January 2023.
Samuel Haig, MetaMask Swaps add support for Layer-2 networks Arbitrum and Optimism, The Defiant, accessed on 1 January 2023.
