
Following the discussion of the Bitcoin Spot ETF, Bitcoin (BTC) price still shows no signs of increasing. Instead, selling pressure has increased, leading to a notable price drop. Currently, BTC is in a critical zone, struggling to maintain the $40,000 price level. Could this decline continue? Let’s delve into the analysis below.
As usual, the Pintu trading team has gathered critical information and analyzed the general economic situation and the crypto market’s movements over the past week. However, it should be noted that all information in this Market Analysis is intended for educational purposes, not as financial advice.
Market Analysis Summary
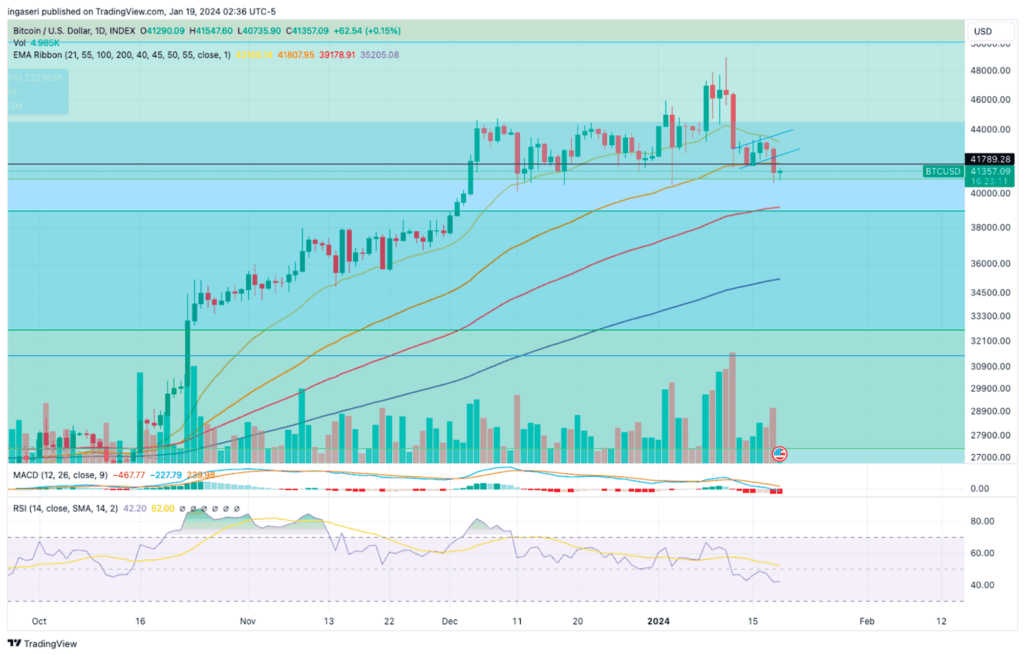
- ⚠️ BTC has broken the 55-day Exponential Moving Average (EMA) line at $42K, there is potential for further downside if it breaks $40K.
- 🏭 The United States (US) Producer Price Index (PPI) in December fell -0.1% month-on-month. On an annualized basis, the PPI rose from 0.8% to 1.0%, below expectations of 1.3%, while the PPI without food, energy, and trade services rose slightly from 2.4% to 2.5%.
- 📉 Business activity in New York State in January 2024 decreased 29 points to -43.7 which is the lowest level since May 2020.
- 💼 Initial applications for unemployment benefits in the US declined by 16,000 to 187,000 signaling labor market resilience despite rising interest rates.
Macroeconomic Analysis
Producer Price Index (PPI)
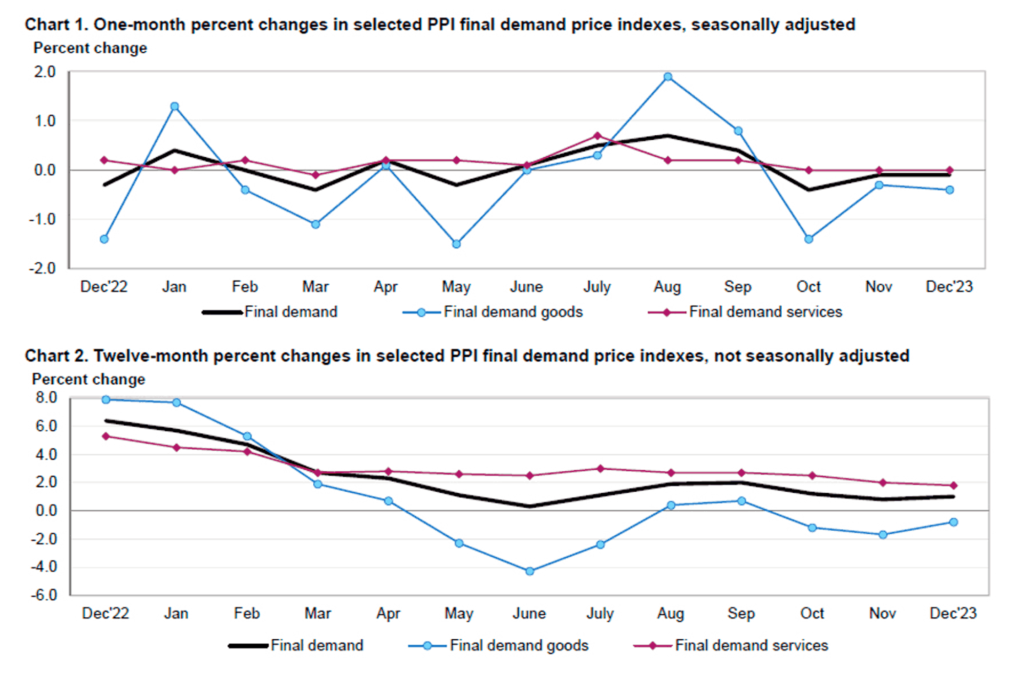
In December, the United States (US) Producer Price Index (PPI) for final demand decreased month-on-month by -0.1%, lower than the expected increase of 0.1%. The decline was driven by a 0.4% drop in the PPI for goods, while the PPI for services was unchanged. However, when excluding the impact of food, energy, and trade services, the PPI showed a slight increase of 0.2% month-on-month.
On a 12-month basis, the PPI showed a year-on-year increase from 0.8% to 1.0%, well below expectations of 1.3%. Meanwhile, PPI, excluding food, energy, and trade services, increased year-on-year from 2.4% to 2.5%.
Other Economic Indicators
- NY Empire State Manufacturing Index: January 2024 saw a decline in business activity in New York State, according to the Empire State Manufacturing Survey. The headline general business conditions index plummeted by 29 points to -43.7, the lowest level since May 2020. This decline affected new orders, shipments, and employment. While some improvement is expected over the next six months, many companies remain pessimistic about the recovery’s pace.
- Retail Sales: A 0.6% increase in retail sales during January 2024, boosted by higher activity in clothing stores, accessories, and non-store online businesses, exceeded predictions by Dow Jones (0.4%). Even excluding car sales, the 0.4% increase still surpassed expectations. This rise comes amid speculation about the strength of the US economy entering the new year, with expectations of growth slowing down. However, the resilience of the consumer sector might indicate continued momentum, prompting caution from The Fed in deciding how to proceed with interest rates.
- Building Permits: December saw a 4.3% decrease in new residential construction in the US, reaching 1.460 million units. This exceeded the consensus forecast (1.426 million) and was 7.6% higher than December 2022. Meanwhile, the number of building permits increased significantly by 1.9% to 1.495 million, exceeding market expectations (1.480 million) and 6.1% higher than the previous year. Throughout 2023, the number of housing units built (1.413 million) decreased by 9% compared to 2022. Similarly, the number of building permits issued (1.470 million) fell by 11.7%. In contrast, home completions rose 4.5% year-over-year to 1.453 million in 2023.
- Initial Unemployment Claims: US initial unemployment claims decreased by 16,000 to 187,000 for the week ending January 13, marking the lowest level in a year, according to the US Department of Labor. This points to the strength of the labor market despite rising interest rates. Continuing claims also fell to 1.81 million, the lowest in almost three months, for the week ending January 6. These figures diverge from economists’ predictions of increased unemployment over the past year. However, other indicators like the Federal Reserve survey suggest a moderating labor market, which the Fed will closely monitor when considering potential interest rate adjustments.
BTC Price Analysis
The BTC chart reveals a phase of price consolidation marked by an ascending flag pattern, indicating equilibrium between buyers and sellers. Despite Bitcoin’s recent upward momentum, increased selling pressure emerged, resulting in a significant drop in prices.
Presently, BTC has breached the lower boundary of the flag, situated around the $42K support zone. BTC’s price is currently below this critical level. This aligns with BTC breaching the 55-day EMA line at 42K, indicating a potential move toward the 40K support line. While surpassing the psychological barrier of 40K presents a challenge, there is a likelihood of a decline toward the significant support region around $38K.
However, considering the current market conditions, there is also the possibility of Bitcoin entering a period of mid-term consolidation before embarking on its next significant price movement.
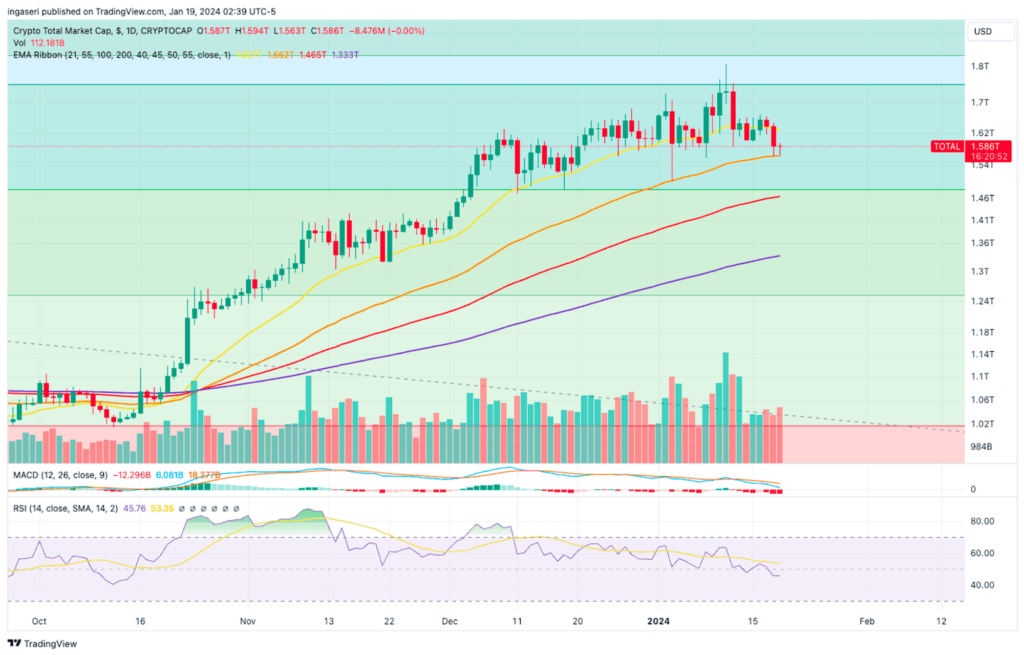
In the past two days, the entire cryptocurrency market experienced a decline, breaking below the 21-day EMA and finding support at the 55-day EMA line, totaling 1.56 trillion USD. The period leading up to the halving at the end of April is anticipated to involve predominantly sideways movements, although some volatility may emerge. It is crucial to monitor the 55-day EMA line; a breach of this support could potentially lead to a decline toward the market cap line of 1.46 trillion USD.
On-Chain Analysis
- 📊 Exchange: As the exchange reserve continues to fall, it indicates lower selling pressure. Net deposits on exchanges are low compared to the 7-day average. Lower deposits can be interpreted as lower selling pressure.
- 💻 Miners: Miners’ are selling more holdings compared to its one-year average. Miner’s revenue is in a moderate range, compared to its one-year average.
- 🔗 On-Chain: More investors are selling at a profit. In the middle of a bull market, it can indicate a market top. Long-term holders’ movement in the last 7 days was higher than the average. If they were moved for selling, it may have a negative impact. Investors are in an anxiety phase where they are currently in a state of moderate unrealized profits.
- 🏦 Derivatives: Long-position traders are dominant and are willing to pay short traders. Selling sentiment is dominant in the derivatives market. Takers fill more sell orders. As open interest decreases, it indicates investors are closing futures positions and the possibility of trend reversals. In turn, this might trigger the possibility of long/short squeeze caused by sudden price movement or vice versa.
- 🔀 Technicals: RSI indicates a neutral condition. Stochastic indicates an oversold condition where the current price is close to the bottom of the last 2 weeks and a trend reversal can occur.
News About Altcoins
- Conflux Network announces the launch of its Bitcoin Layer 2 solution compatible with the Ethereum Virtual Machine (EVM). By harnessing the power of Bitcoin and integrating it into its network, the solution enables Bitcoin to be used as a native currency for gas fees, facilitates the transfer of diverse assets from Bitcoin, and supports high-level security for third-party smart contracts. With Proof of Stake (PoS) consensus that includes BTC staking, Conflux offers stronger security and decentralization through PoS infrastructure involving over 300 nodes and the use of Verifiable Secret Sharing (VSS)-based key sharing. It enables EVM-based Bitcoin asset management and xRC20 tokens, as well as fosters innovation in the field of Decentralized Finance (DeFi) and blockchain applications. The launch is expected to increase adoption, innovation, and cross-chain interaction in the blockchain ecosystem.
News from the Crypto World in the Past Week
- JPMorgan Skeptical of Spot Ethereum ETF Approval by SEC. JPMorgan thinks there is less than a 50% chance that the SEC will approve a spot Ethereum ETF in May. According to JPMorgan’s Nikolaos Panigirtzoglou, for the SEC to approve a spot Ethereum ETF, they would have to classify Ethereum as a commodity instead of a security. Although the SEC recently approved a spot Bitcoin ETF after years of denial, and ether prices experienced a significant rise, Panigirtzoglou stated that the SEC still views other cryptocurrencies besides Bitcoin as securities. This is also supported by SEC Chairman Gary Gensler’s comments of being reluctant to classify ETH as a security, while some other analysts, including those from Bloomberg Intelligence, are more optimistic about the approval of a spot Ethereum ETF. Several companies, including BlackRock and Fidelity, have applied for a spot Ethereum ETF.
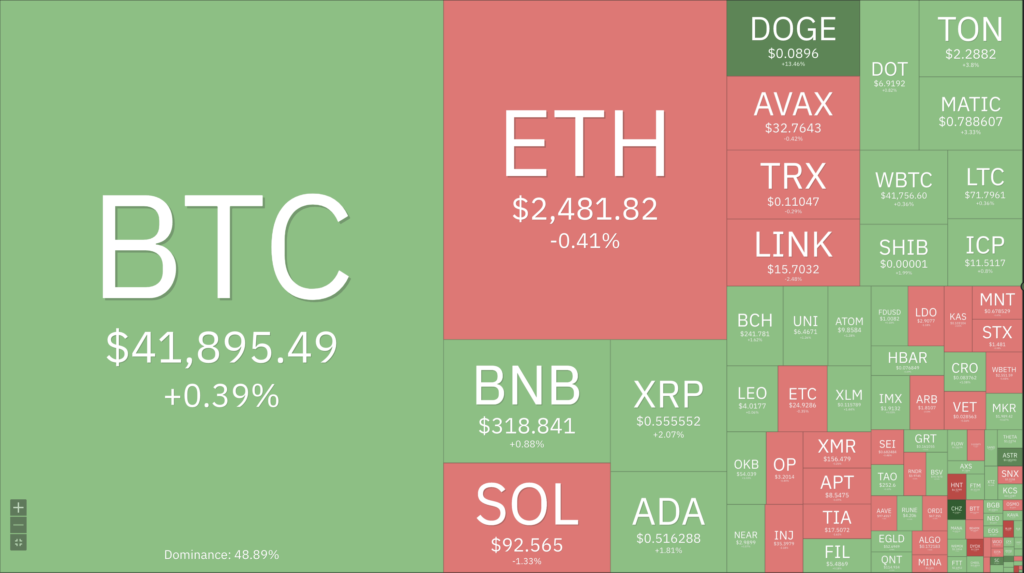
Cryptocurrencies Market Price Over the Past Week
Cryptocurrencies With the Best Performance
- Astar (ASTR) +22,31%
- Chiliz (CHZ) +19,92%
- Dogecoin (DOGE) +10,37%
- Chainlink (LINK) +18,86%
Cryptocurrencies With the Worst Performance
- SATS (1000SATS) -23,48%
- Bonk (BONK) -22,98%
- Arbitrum (ARB) -16,56%
- Optimism (OP) -15,59%
References
- Conflux Network, Unlocking the Potential of Bitcoin: Introducing Conflux Network’s EVM-Compatible Bitcoin Layer 2 Solution!, medium, accessed on 22 January 2024.
- Yogita Khatri, JPMorgan doesn’t see more than 50% chance of spot Ethereum ETF approval by May, theblock, accessed on 22 January 2024.