
The US economy has performed better than expected in the last quarter of 2022. Meanwhile, various indicators also show the crypto market is picking up right now.
Pintu’s trader team has collected various important data about macroeconomic analysis and crypto market movement over the past week, summarized in this Market Analysis. However, you should note that all information in this Market Analysis is for educational purposes, not financial advice.
Market Analysis Summary
- ☀︠The US economy has performed better than expected in the last quarter of 2022.
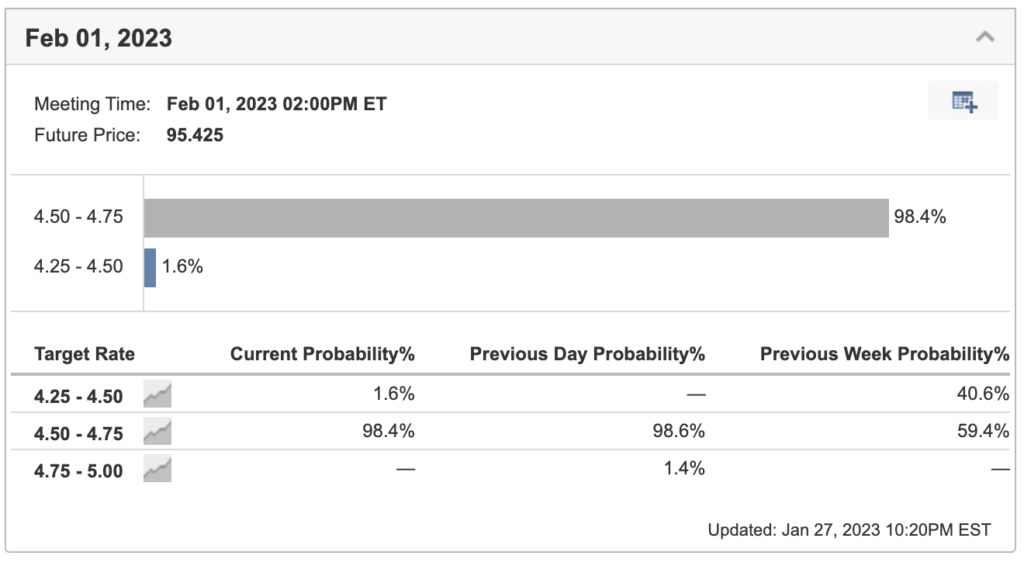
- 🆙 It is expected that the FOMC will increase the federal funds rate by 0.25% on February 1st.
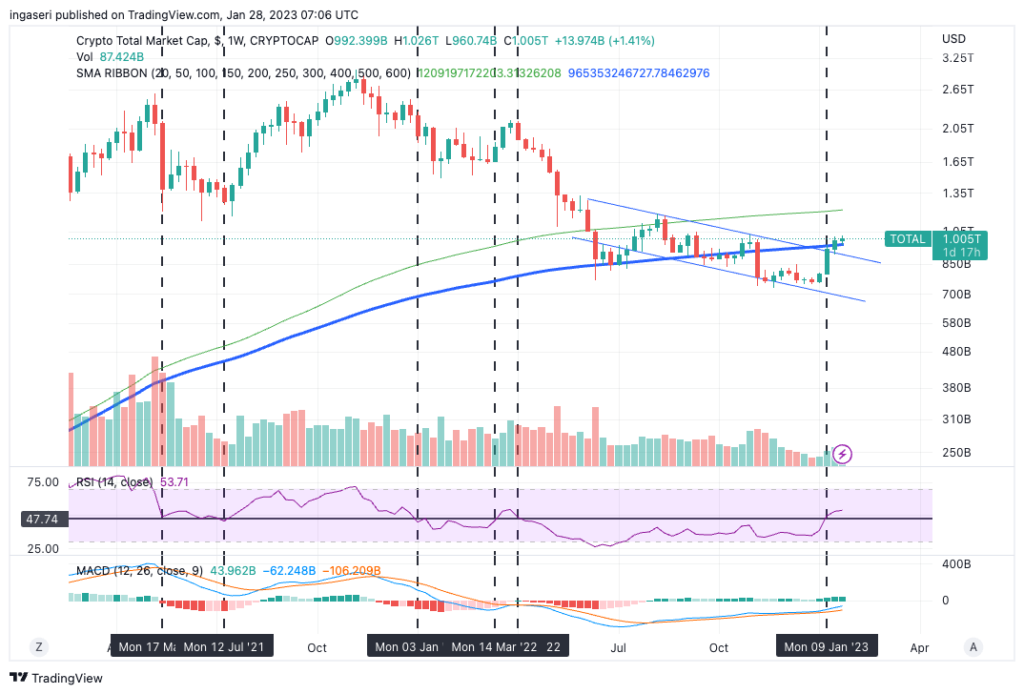
- 🚨 The crypto market has closed its weekly candle above the 200-week MA resistance line after spending close to 4 months below the line.
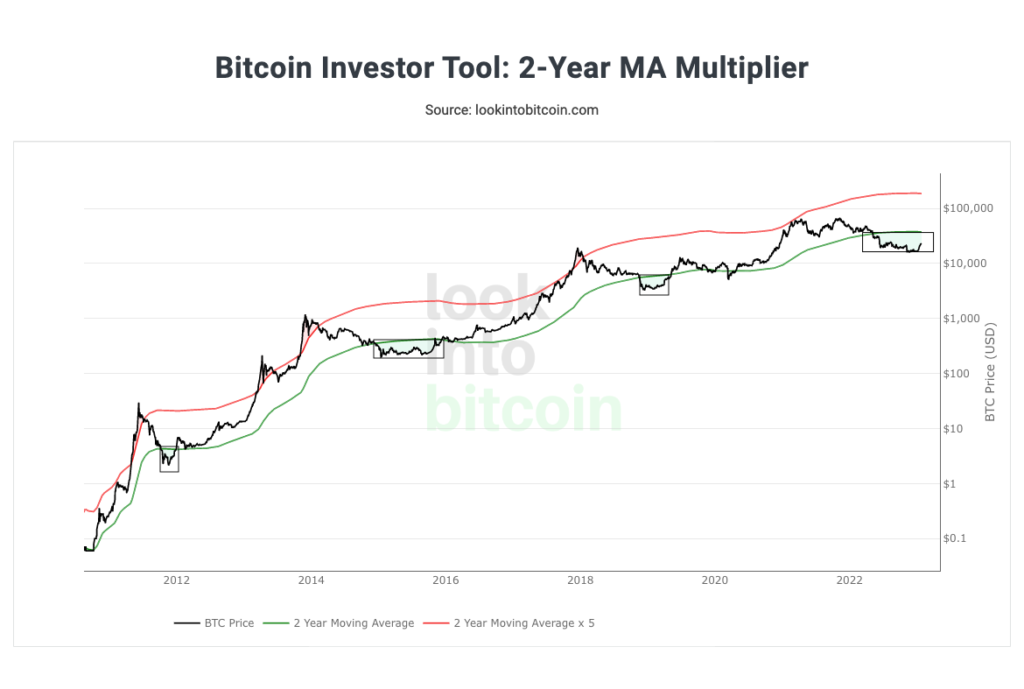
- 🪙 Bitcoin is still in the accumulation area by looking at the 2-year MA multiplier chart.
- 📈 Various indicators also show the crypto market is in a positive trend.
Macroeconomic Analysis
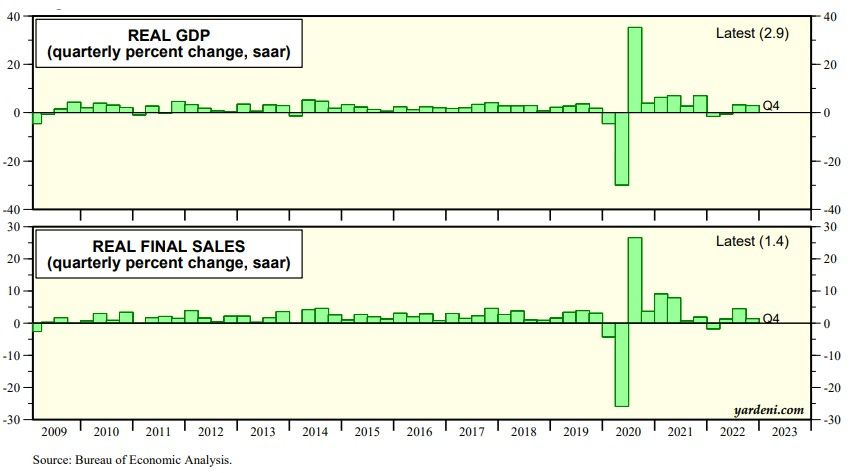
The US economy has performed better than expected in the last quarter of 2022, with a mild slowdown. This is what the Fed aims to achieve while controlling inflation and maintaining growth.
However, economists have identified several potential risks, in particular the decrease in demand among American consumers. This suggests that a recession is still a possibility for this year.
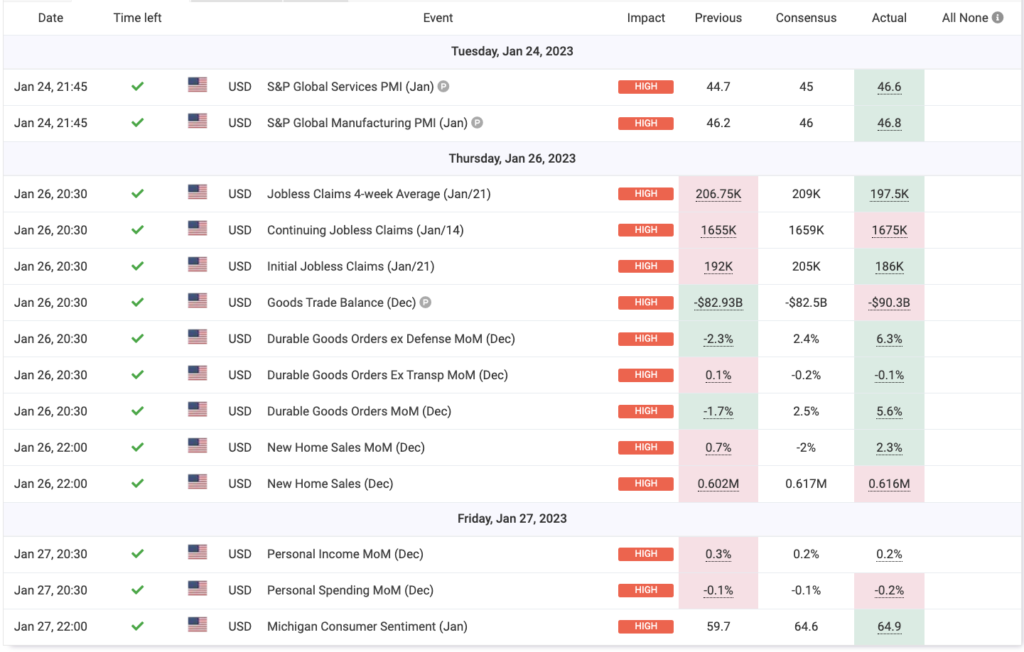
Real GDP rose 2.9% vs. 3.2% during Q3. However, real final sales of domestic products rose only 1.4% during Q4 down from 4.5%. Additionally, a report on labor markets released on Thursday showed a strong economy, with a surprise decrease in weekly unemployment claims (186k vs. 192K previous vs. 205k consensus).
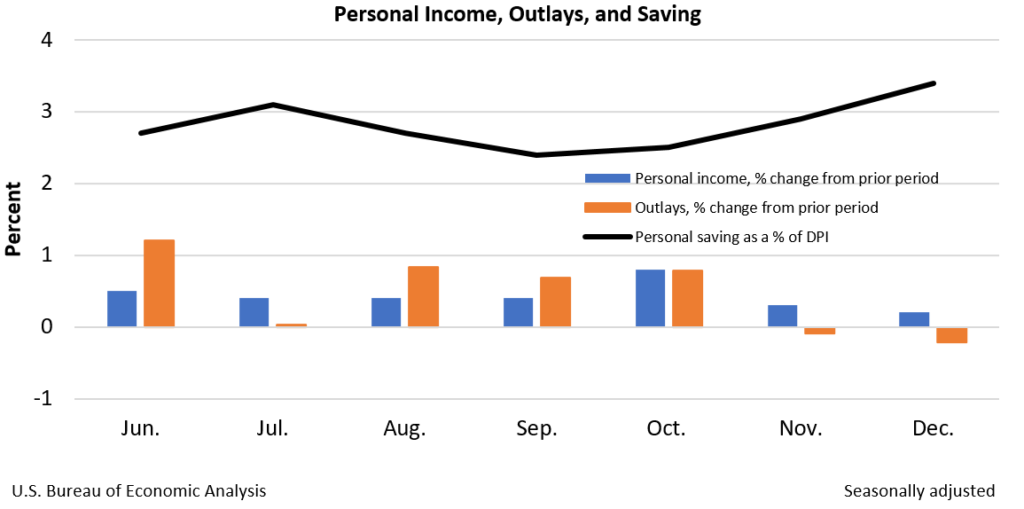
The Federal Reserve’s preferred inflation indicators decreased in December to the lowest levels in over a year while consumer spending decreased, making it easier for policymakers to reduce the frequency of interest rate increases.
Following are the results of several US economic indicators in December:
- PCE MoM. The data of personal consumption expenditures (PCE) declined 0.2% on the month, worse than the 0.1% drop that Wall Street had been anticipating.
- Real PCE (Chained 2012 $) rose by 0.4% in October, but then decreased by 0.2% in November and further dropped by 0.3% in December. This is likely due to the Federal Reserve’s efforts to curb high inflation.
- PCE Index YoY (excludes food and energy), increased by 4.4% in December compared to the previous year. The overall index rose by 5% year-over-year, which is still above the Fed’s 2% target, but both were the lowest rates since late 2021.
- PCE Index MoM. The core gauge of inflation, rose 0.3% in comparison to the previous month. The overall PCE price index also increased by 0.1% MoM. Fed Chair Jerome Powell has emphasized this data as a better indicator of future inflation.
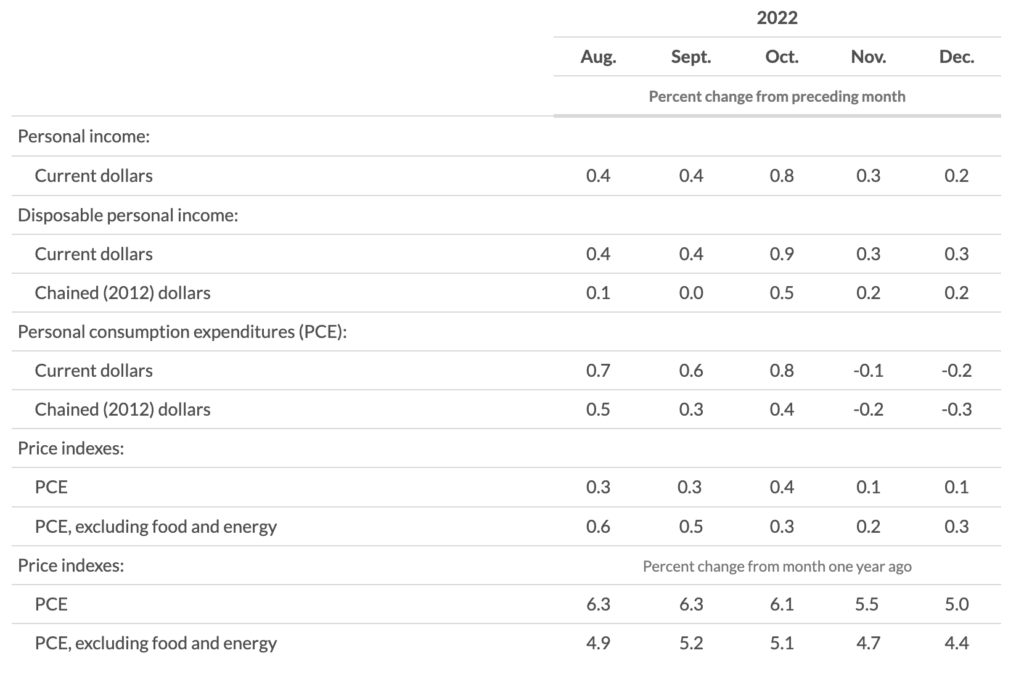
Personal income, on the other hand, rose as predicted at 0.2%.
It is expected that the FOMC will increase the federal funds rate by 0.25% on February 1st, in light of recent indicators. This move is likely to result in positive reactions in both stock and bond prices.
Bitcoin Price Analysis
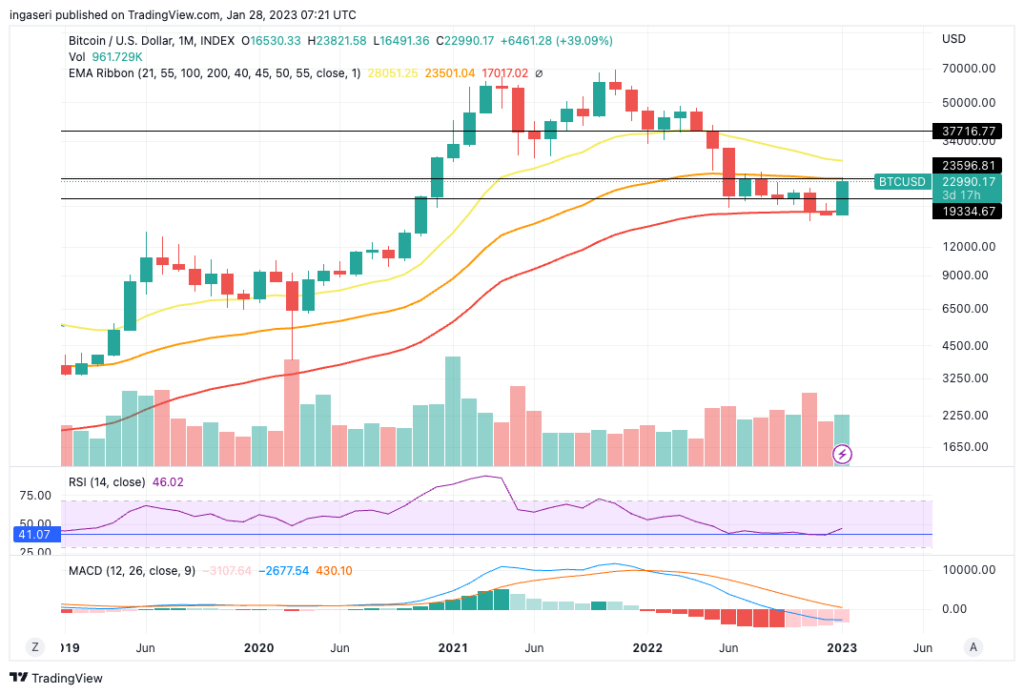
The crypto market has closed its weekly candle above the 200-week MA resistance line after spending close to 4 months below the line. The 1 Trillion Market cap is a huge resistance, which also acts as a strong support should we manage to find support. The next step is to find anchor support at 1T market cap and 200-week MA line.
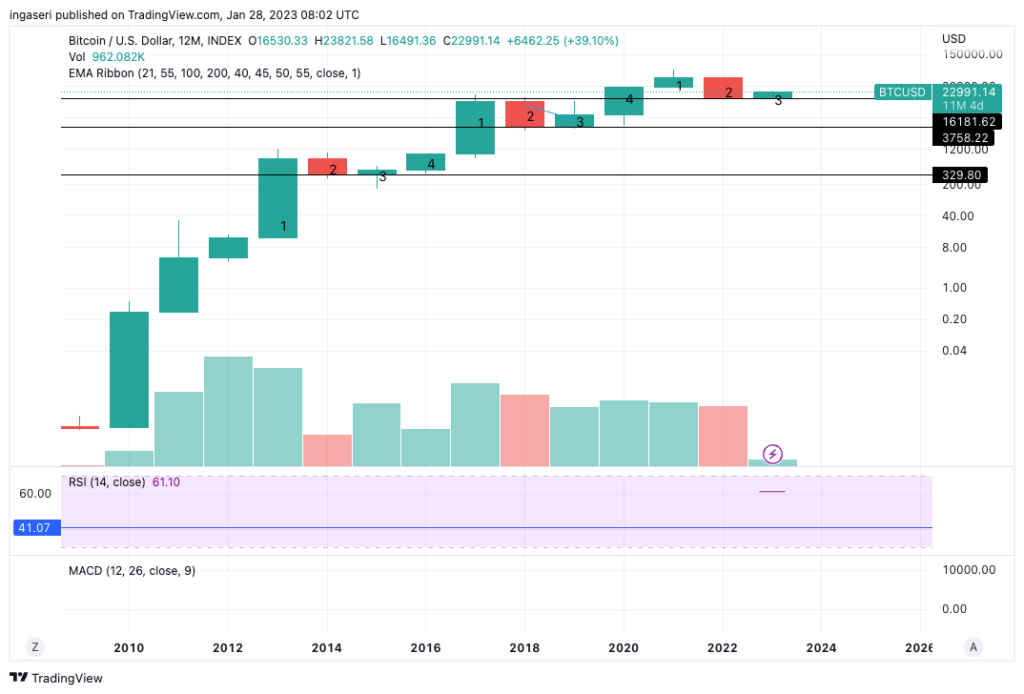
For longer-term plays, we are still in the accumulation area by looking at the 2-year MA multiplier chart below
On the weekly chart, we can see that we are at the edge of the 0.236 Fibonacci retracement line. moving move this line would boost the price action and create the right momentum to go beyond the historically important 200 weeks MA, which is at 25k.
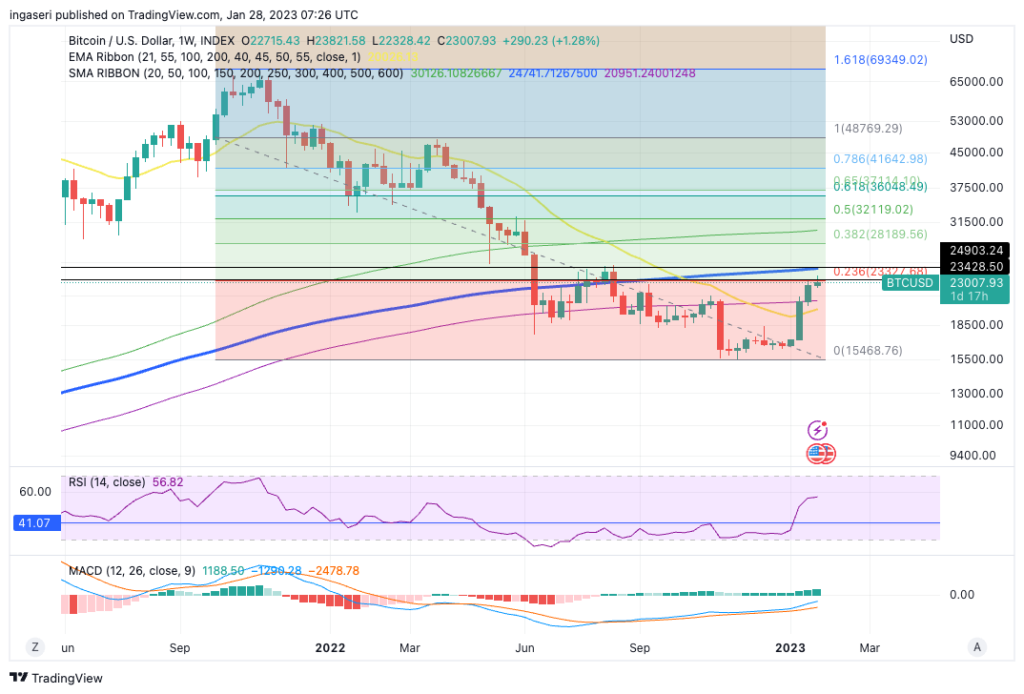
On the monthly candle, as we approach the end of January, we need to be able to rise above the 55 months EMA resistance line, which is at 23,500. The next step is to find support at that line.
On-Chain Analysis
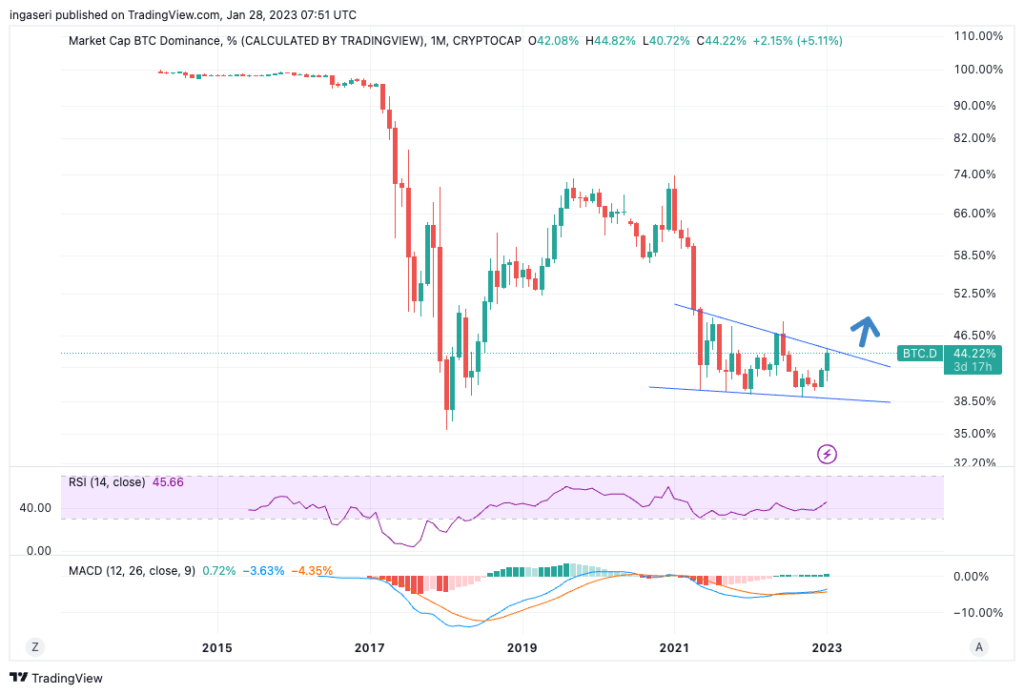
We have been seeing altcoin rising spectacularly over the week. What we are seeing is more of a speculative, micro money flow cycle. We still need to see a BTC money flow from fiat, then to the usual large, mid, and then low caps before confirming the macro money flow cycle. Looking at the Bitcoin dominance chart, we are forming a falling wedge pattern, which signals a future upside toward Bitcoin dominating.
Looking at the yearly candle, 2024, the halving year is suggesting a revisit of the 20K region before pushing towards a bull market run.
Indicators that is signaling that the market is picking up right now:
- Network fees refer to the total amount of money spent on a specific blockchain. These fees can indicate the level of demand for using Bitcoin or Ether. We have seen the BTC fees have reached their highest since the FTX debacle. Also, ETH fees have only recently declined after rising for 4 consecutive weeks.
- The exchange net flows. Currently, we have seen that nearly $100 million worth of BTC left CEXs this week. We have seen a net outflow of $400 million of ETH over the past 2 weeks. Typically a new outflow represents accumulation and an inflow to CEXs indicates selling pressure.
- The total market cap of stablecoin has seen a monthly increase, this points to liquidity demand. The availability of liquidity in the cryptocurrency market is largely influenced by the number of stablecoins in circulation, as many exchanges use stablecoins as the base currency for trading pairs.
- The price of futures contracts has also returned to being higher than spot market prices after falling below them in November and December. Currently, both futures and perpetual swaps are indicating a bullish market trend, as prices are higher than spot market prices and funding rates are slightly positive (0.01%). This is known as being in contango.
On-Chain Analysis:
📊 Exchange: As the exchange reserve continues to fall, it indicates lower selling pressure. Net deposits on exchanges are high compared to the 7-day average. Higher deposits can be interpreted as higher selling pressure.
💻 Miner: Miners’ are selling holdings in a moderate range compared to their one-year average. Miner’s revenue is in a moderate range, compared to its one-year average.
🔗 On-Chain Indicator: More investors are selling at a loss. In the middle of a bear market, it can indicate a market bottom. Long-term holders’ movement in the last 7 days were lower than the average. They have the motive to hold their coins. Investors are in a Fear phase where they are currently with unrealized profits that are slightly more than losses.
🏦Derivatives: Long-position traders are dominant and are willing to pay short traders. Buying sentiment is dominant in the derivatives market. More buy orders are filled by takers. As OI decreases, it indicates investors are closing futures positions and the possibility of trend reversals. In turn, this might trigger the possibility of a long/short squeeze caused by sudden price movement or vice versa.
🔀 Technical Indicator: RSI indicates an Overbought condition where 80.00% of price movement in the last 2 weeks has been up and a trend reversal can occur. Stochastic indicates an Oversold condition where the current price is close to its high in the last 2 weeks and a trend reversal can occur.
Altcoin News
- 💡 Ethereum successfully created a shadow fork to provide a testing environment ahead of a Shanghai update. During this latest shadow fork, developers focused on creating a testing environment for staked ETH withdrawals and improvements to reduce gas costs. Some minor glitches were reported during the testing. This shadow fork brings the much anticipated Shanghai upgrade closer to the Ethereum mainnet, expected in March 2023.
- 🔗 Lending DeFi Platform AAVE deploys V3 protocol on Ethereum. In the V3 protocol, AAVE includes several features, such as high-efficiency mode, isolation mode, and gas optimization algorithm that will reduce gas fees by 20-25%. The deployment comes after DAO member Aave agreed to a proposal submitted last year. Besides Ethereum, AAVE V3 also was deployed to Avalanche, Arbitrum, Optimism, and Polygon.
More News from Crypto World in the Last Week
- 🖼 E-commerce giant Amazon to launch gaming-focused NVT initiative. Currently, the initiative is still in the development phase, but the deadline for the launch is set as April. One of the use cases will allow Amazon users to play blockchain-based games and claim free NFT. Amazon CEO Andy Jassy said that he expected the NFT market to grow further and that Amazon could add crypto payments.
- 🚨 FBI confirms Lazarus Group and APT38 were responsible for $100 million Harmony’s bridge hack. The incident occurred in June 2022, and they attempted to launder the money through the RAILGUN privacy protocol. In addition, The FBI said that the stolen funds are being used by North Korea to fund its ballistic missile and weapons of mass destruction programs.
- 👟 Nike’s Web3 Platform .SWOOSH Will Reward Creators for Virtual Sneaker Designs. .SWOOSH, Nike’s new NFT platform, is inviting users to participate in a challenge to build a visual storyboard on Instagram showcasing their footwear design. If chosen, four winners will earn $5,000 each and receive an opportunity to work directly with Nike designers to create their own one-of-one digital sneakers.
Cryptocurrencies Market Price Over the Past Week
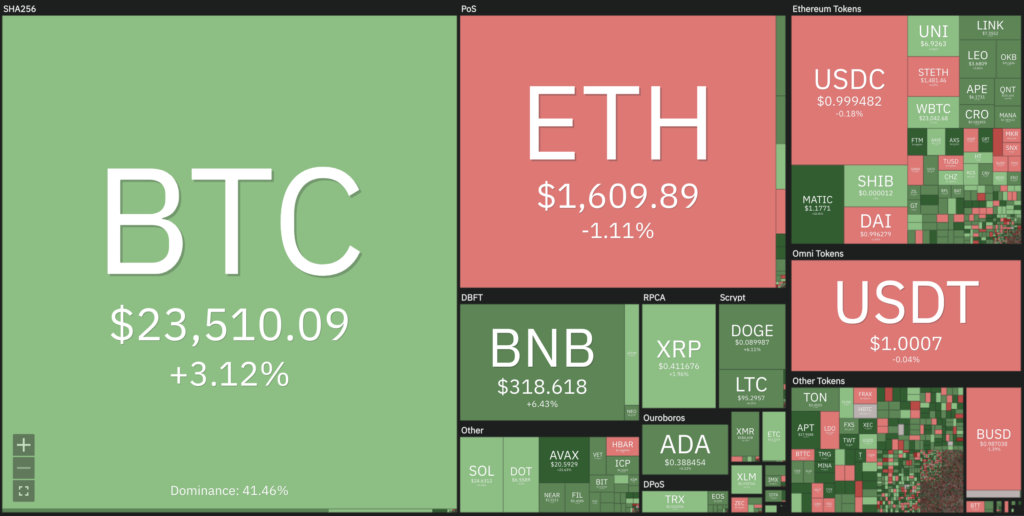
Cryptocurrencies With the Best Performance
- Aptos (APT) +32.08%
- GMX (GMX) +25.18%
- Fantom (FTM) +24.16%
- Gala (GALA) +20.46%
- Polygon (MATIC) +17.06%
Cryptocurrencies With the Worst Performance
- Terra 2.0 (LUNA) -7.91%
- Maker (MKR) -6.67%
- Flow (FLOW) -6.27%
- Synthetix (SNX) -5.74%
- The Sandbox (SAND) -4.75%
Reference
Margaux Nijkerk, Latest Ethereum ‘Shadow Fork’ Brings Blockchain’s Shanghai Upgrade Closer to Reality, CoinDesk, accessed on 29 January 2023.
Tom Blackstone, Aave deploys v3 on Ethereum after 10 months of testing on other networks, Coin Telegraph, accessed on 29 January 2023.
Mike Truppa, FBI confirms Lazarus Group and APT38 were responsible for $100 million bridge hack, The Block, accessed on 29 January 2023.
Zeynep Geylan. Amazon to launch gaming-focused NFT initiative. Crypto Slate, accessed on 29 January 2023.
Cam Thompson, Nike’s Web3 Platform .SWOOSH Will Reward Creators for Virtual Sneaker Designs, Coin Desk, accessed on 28 January 2023.