
The Fed will maintain higher interest rates for an extended period as US economic data remains solid. The problems experienced by Silvergate Bank shook the price of Bitcoin and the crypto industry. Find out the full explanation by reading the following market analysis.
The Pintu trader team has collected various data that analyze macroeconomics and the crypto market movement in the past week. However, kindly pay attention that all information in this market analysis is for education purposes only, not financial advice.
Market Analysis Summary
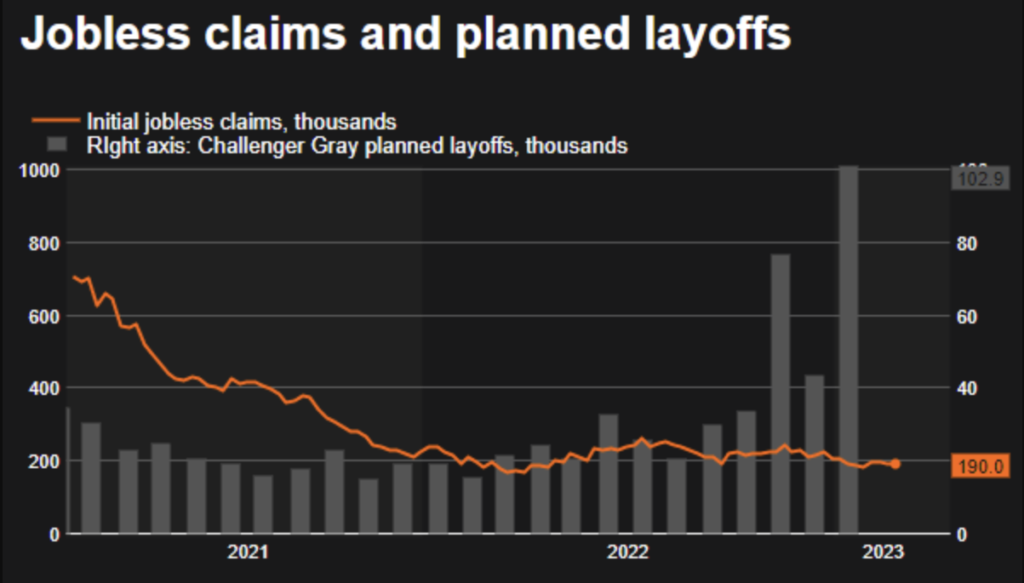
- 💪 The labor market is still very strong and resilient as weekly jobless claims fall 2,000 to 190,000 and continuing claims drop 5,000 to 1.655 million.
- 🚨 With the labor market still going strong and the inflation rate remaining high, Fed may need to maintain higher interest rates for an extended period.
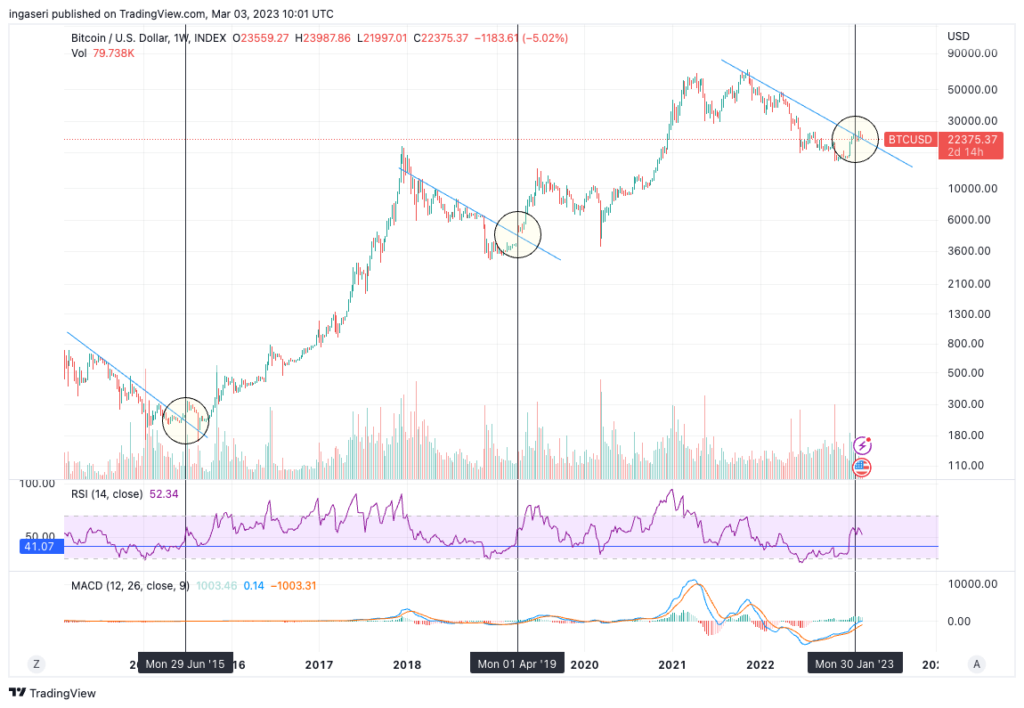
- 📉 BTC experienced a decline of up to 6% as the effects of the Silvergate fallout was felt in the digital asset industry. We can see the BTC is still above the downtrend support line on the weekly chart.
- ⛔ ETH is still facing 50 weeks of Moving Average MA as resistance for the 3rd consecutive week.
Macroeconomic Analysis
The decline in the number of Americans submitting new claims for unemployment benefits last week indicates that the labor market remains robust, which is causing concern in financial markets that the Federal Reserve may extend its interest rate hikes.
According to the Labor Department, for the week ending on February 25th, the number of initial applications for state unemployment benefits decreased by 2,000 and was seasonally adjusted to 190,000. This marks the seventh consecutive week that claims have remained under 200,000.
The likelihood of the Fed raising interest rates has risen due to the resilience of the labor market and persistently high inflation. Instead of two increases, it is now probable that the central bank will raise rates at least three more times this year.
Since last March, the policy rate has been increased by 4.5%, with most of the hikes occurring between May and December, bringing it to its current range of 4.50%-4.75%. The potential for continued high inflation is a concern. Another report from the Labor Department reveals that unit labor costs, which reflect the cost of labor per unit of output, grew at an annualized rate of 3.2% in the last quarter, which is higher than the 1.1% pace reported last month. Labor costs experienced a 6.9% increase in the third quarter and notable gains in the preceding two quarters.
According to the report on claims, the number of individuals who received benefits after one week of aid decreased by 5,000, reaching 1.655 million at the end of the week ending on February 18. These “continuing claims” are used as a measure for employment and were observed during the period in which households were surveyed for the unemployment rate in February.
There is no doubt that the labor market is very strong and resilient.
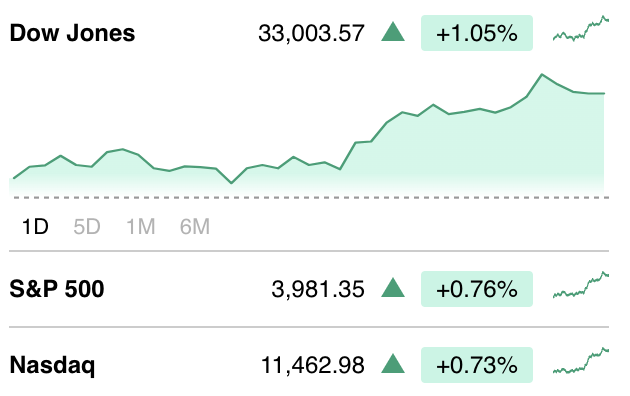
On Friday, the Asian stock market saw an increase in value due to positive expectations for China’s economic recovery, as well as a reversal of previous losses on Wall Street. This was spurred by the comments of the Atlanta Fed chief, which indicated a cautious approach towards raising interest rates in the United States. Despite recent strong U.S. data, such as jobless claims, which suggested that the Fed may need to maintain higher interest rates for an extended period, global markets have been fluctuating.
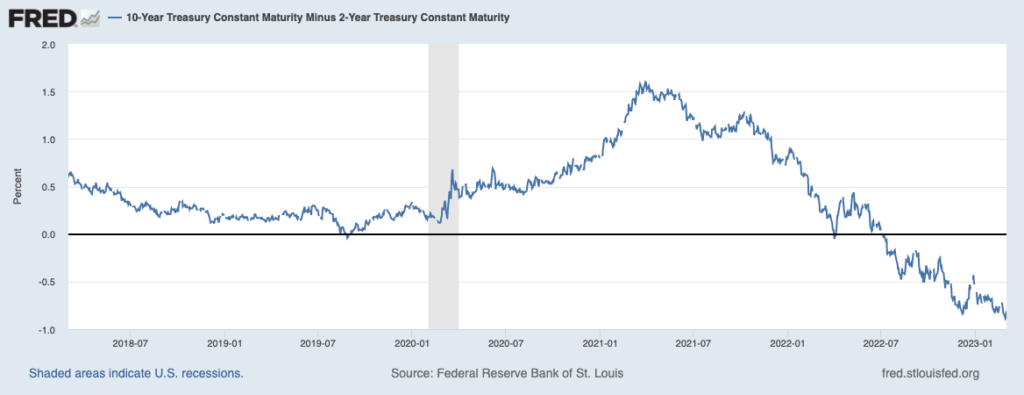
On Wednesday, the yield of 10-year US Treasury notes reached 4%, driven by traders selling government debt in anticipation of a prolonged period of elevated interest rates. This marks the highest point in yield since November, with levels last seen over a decade ago. The yield of the 10-year note increased by approximately 0.08 percentage points, while the two-year note’s return rose by 0.09 percentage points to 4.88%, reaching a 16-year high the previous day. The movement in the Treasury markets resulted in the yield curve having its sharpest inversion in 42 years.
An inverted yield curve, where short-dated bonds have higher yields than longer-dated bonds, is often considered a predictor of an economic recession.
This is the economic calendar for the month of March:

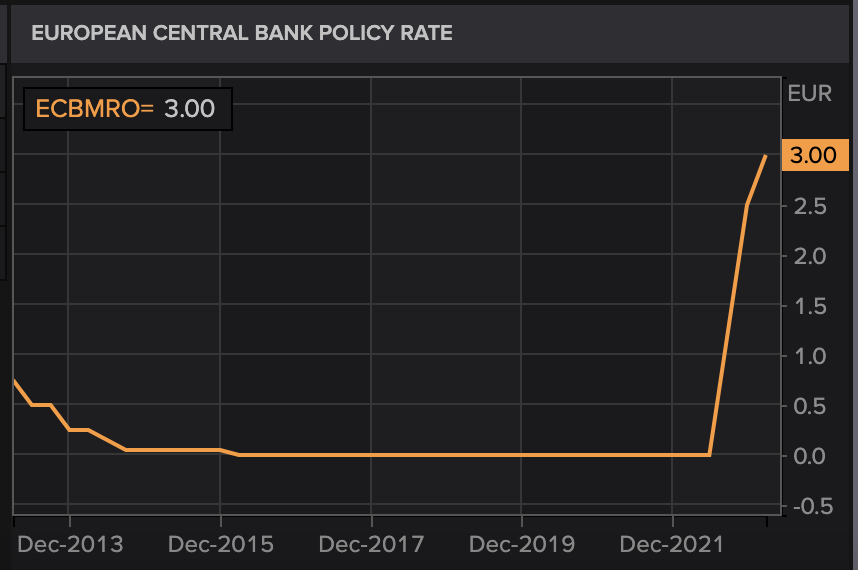
In Europe, Pierre Wunsch, a member of the ECB governing council and the governor of the Belgian National Bank, stated that if there is persistent underlying inflation, the ECB may contemplate increasing its key interest rate to up to 4%. In July 2022, the ECB increased rates from a historic low of -0.5% to 2.5%. According to a note to clients from Barclays, the bank anticipates rate increases of 50 basis points in March and May, followed by 25 basis point hikes in June and July.
Bitcoin Price Analysis
On Friday, Bitcoin experienced a decline of up to 6% as the effects of the Silvergate fallout were felt in the digital-asset industry. The bank suffered a run on deposits last year during FTX’s bankruptcy, which is Silvergate’s key client. Silvergate’s payments network is widely utilized for facilitating real-time transfers of funds between cryptocurrency firms, but due to the bank’s situation, numerous digital-asset exchanges, trading desks, and stablecoin issuers have halted accepting or initiating payments via Silvergate.
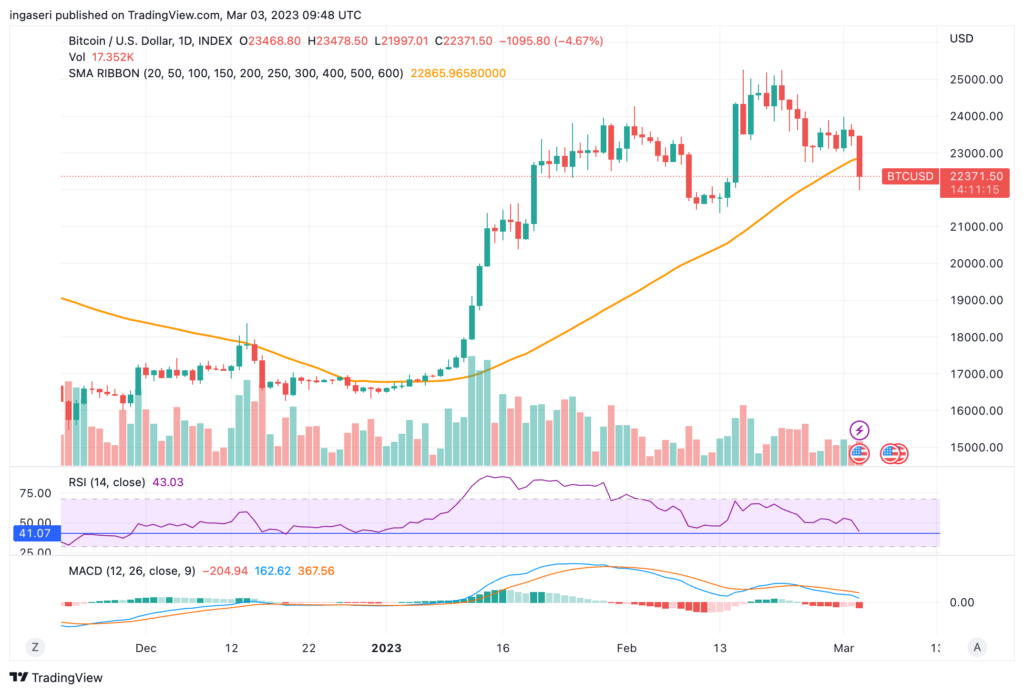
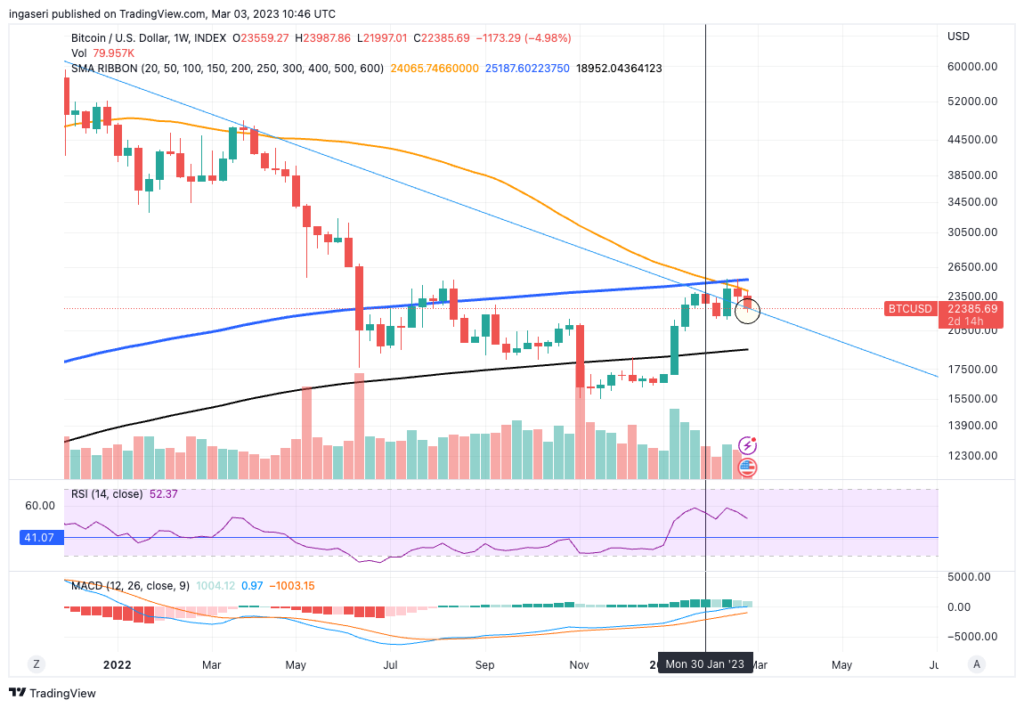
The weekly chart shows that the BTC is still above the downtrend support line. Support is at 22,250. Keeping at this trend would mean BTC still adheres to the cycle pattern before it. As mentioned in the previous week’s analysis, expect BTC price to go sideways between the range of 21-25K.
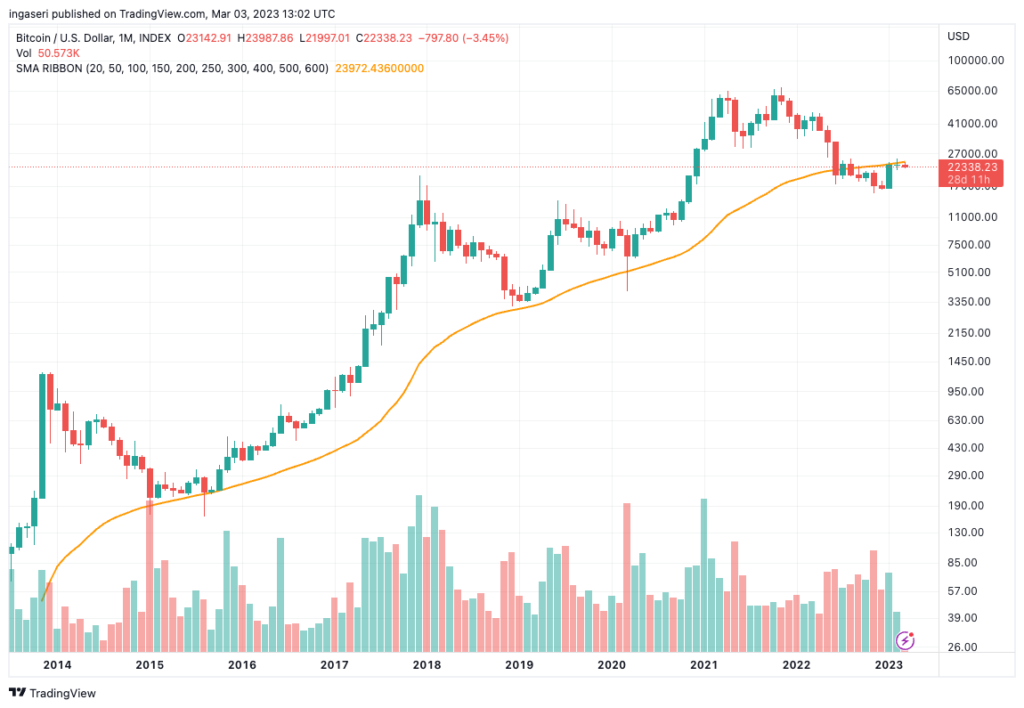
On the monthly chart, BTC closed (yet) below the 50 month moving average. This is the 6th month BTC is below the resistance line.
Ethereum Price Analysis
ETH is still facing 50 weeks MA as resistance for the 3rd consecutive week. Notice the RSI level going down the support value of 52. For the past 2 occasions, once we broke below the value of 52, we experienced significant price action to the downside.
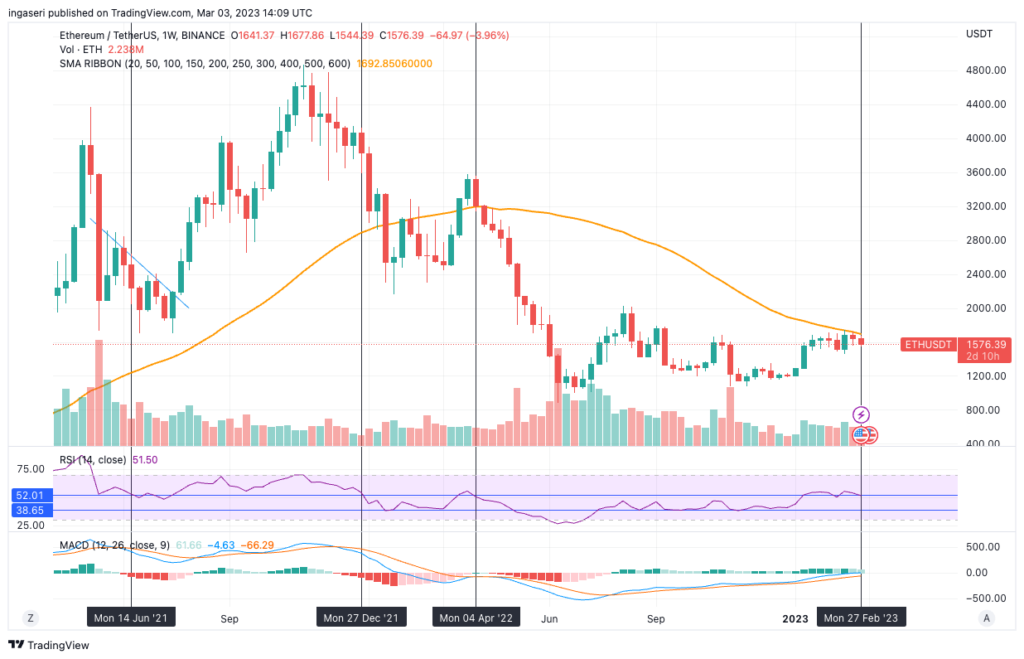
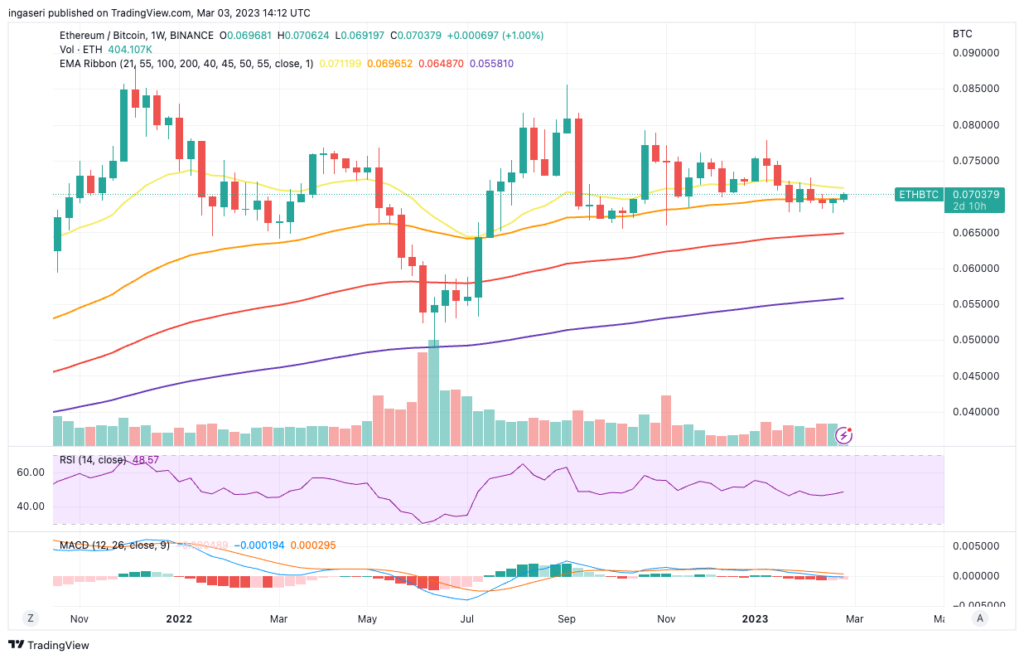
Sementara ETH/BTC pada pekan ini berhasil melewati Exponential Moving Average (EMA) 55 minggu. Jika sampai ditutup di atas level support minggu ini, ETH diekspektasikan akan mempunyai beta yang lebih tinggi.
On-Chain Analysis
📊 Exchange: As the exchange reserve continues to rise, it indicates higher selling pressure. Net deposits on exchanges are low compared to the 7-day average. Lower deposits can be interpreted as lower selling pressure.
💻 Miners: Miners’ are selling holdings in a moderate range compared to their one-year average. Miner’s revenue is in a moderate range, compared to its one-year average.
🔗 On-Chain: More investors are selling at a loss. It can indicate a market bottom in the middle of a bear market. Long-term holders’ movement in the last 7 days was lower than the average. They have the motive to hold their coins. Investors are in a fear phase where they are currently with unrealized profits that are slightly more than losses.
🏦Derivatives: Short position traders are dominant and are willing to pay long traders. Selling sentiment is dominant in the derivatives market. More sell orders are filled by takers. As open interest decreases, it indicates investors are closing futures positions and the possibility of trend reversals. In turn, this might trigger the possibility of a long/short squeeze caused by sudden price movement or vice versa.
🔀 Technicals: RSI indicates an oversold condition where 71.00% of price movement in the last 2 weeks has been down and a trend reversal can occur. The stochastic level indicates a neutral condition where the current price is in a moderate location between the highest-lowest range of the last 2 weeks.
Altcoin News
- ⚡ Ethereum developers push back Shanghai Upgrade to early April. Ethereum developers have been targeting late March for the Shanghai upgrade. However, the All Core Devs flagged some minor issues uncovered after the successful Sepolia testnet upgrade. After that, they turned to schedule the target date for Goerli, the final testnet, on March 14. To move it to the mainnet usually takes time around two weeks. So it will put the Shangai upgrade to the first or second week of April.
- 🌐Polygon (MATIC) launches decentralized ID service powered by ZK proofs. These features allow users to verify their identity without publicly exposing sensitive information. Polygon also said that developers can use its ID service to launch exclusive content for verified users and meet regulatory compliance obligations. That’s in line with Polygon’s aims to provide a solution for Know-Your-Customer (KYC) checks that are becoming increasingly commonplace across the web3 ecosystem.
More News from Crypto World in the Last Week
- 🚨 Silvergate closes the Silvergate Exchange Network (SEN) platform. Crypto-friendly bank Silvergate has delayed filing its 10-K, an annual report on the financial health of the company. This condition leads to Silvergate closing its SEN platform, as a risk-based decision. Unfortunately, SEN has had a crucial role in the crypto industry as it was used by Institutions to move money to crypto exchanges. A number of major blockchain industry companies, including Circle, Blockchain.com, Wintermute, GSR, Coinbase, and Paxos, severed ties with Silvergate.
- 🖼︠NFT sales volume skyrocketed in February. According to data from DappRadar, volume trading in February reached a whopping $2.04 billion, up 117% from $941 million in January. Those figures make February 2023 the best month the NFT market has seen since last May when Terra’s implosion cratered the crypto and NFT market. The surge appears indebted almost entirely to a single source: Blur which the volume jumped over $1.13 billion in February.
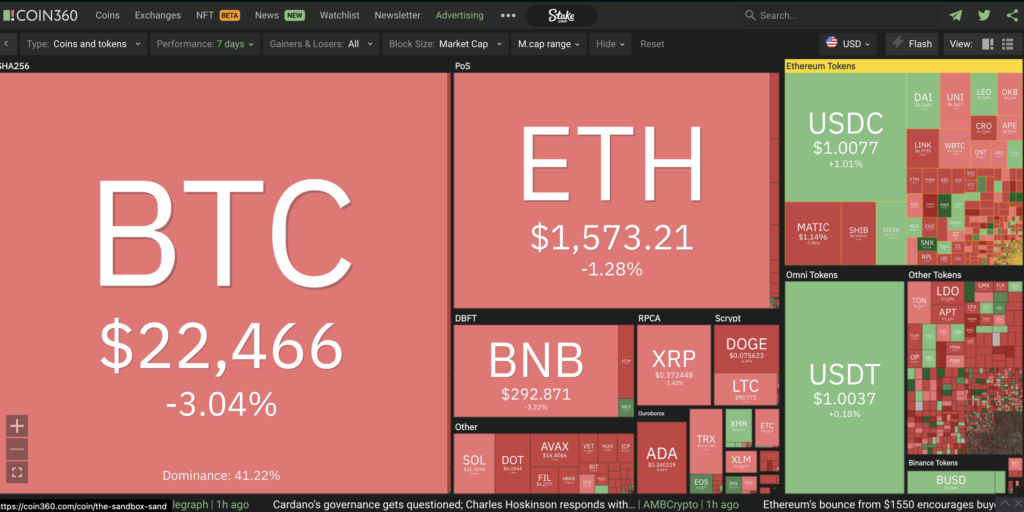
Cryptocurrencies Market Price Over the Past Week
Cryptocurrencies with The Best Performance
- REN (REN) +26,57%
- Synthetix (SNX) +25,94%
- Maker (MKR) +23,93%
- Immutable X (IMX) +13,45%
Cryptocurrencies with The Worst Performance
- Alpha Finance (ALPHA) -22,85%
- Ankr Network (ANKR) -19,57%
- Audius (AUDIO) -19,14%
- Livepeer (LPT) -18,75%
Reference
Macauley Petersen, Ethereum Developers Push Back Shanghai Upgrade to Early April, Blockworks, accessed on 5 March 2023.
Brayden Lindrea, Polygon launches decentralized ID product powered by ZK proofs, Coin Telegraph, accessed on 5 March 2023.
Sander Lutz, NFT Sales Surge to $2 Billion in February—Highest Since Terra Crash. DeCrypt, accessed on 5 March 2023.
Ian Allison, Silvergate Closes SEN Platform Institutions Used to Move Money to Crypto Exchanges, CoinDesk, accessed on 5 March 2023.