
Crypto investors celebrated as Bitcoin (BTC) surged above $67k after weeks of hovering around $60k. The rise was driven by predictions of lower interest rates and positive inflows into the US Bitcoin Spot ETF on May 15th (totaling $303 million). Does this confirm a bullish trend? Check out the full analysis below.
As usual, the Pintu trading team has gathered critical information and analyzed the general economic situation and the crypto market’s movements over the past week. However, it should be noted that all information in this Market Analysis is intended for educational purposes, not as financial advice.
Market Analysis Summary
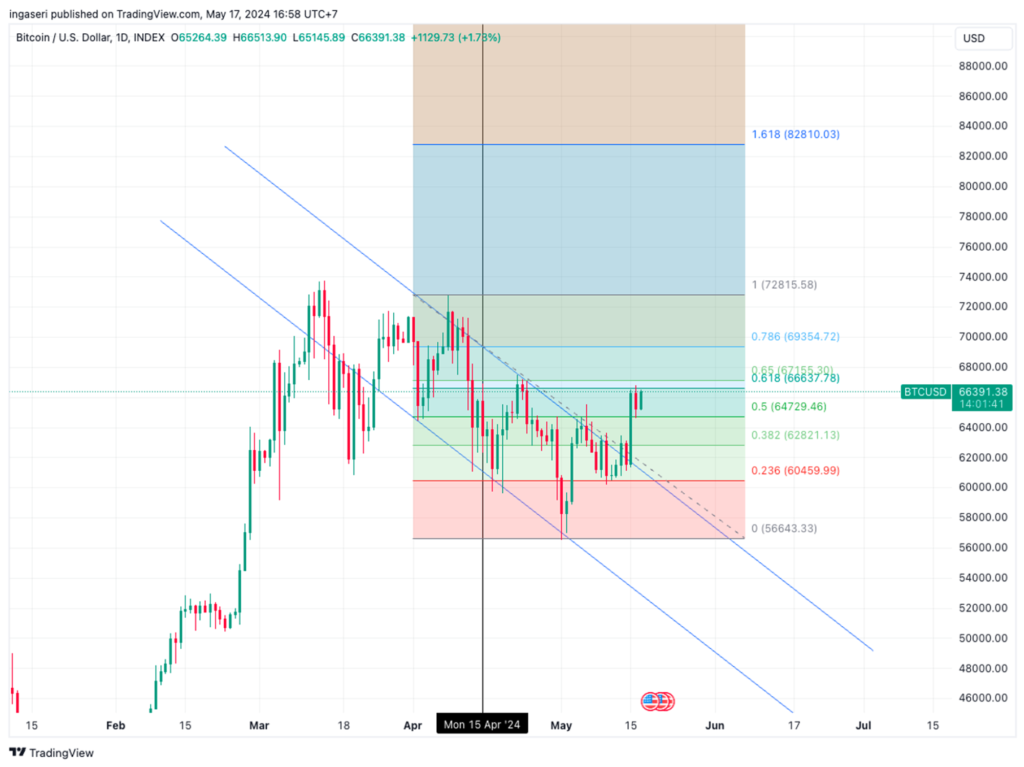
- ✍🏻 BTC faced resistance at the 0,618 Fibonacci retracement level, around $66,500. Investors and traders should watch the next key zone between $67,000 and $69,000.
- 📉 U.S. consumer sentiment sharply declined in May, reaching its lowest level in six months. Respondents cited persistent inflation, high interest rates, and unemployment concerns as the primary reasons for the downturn.
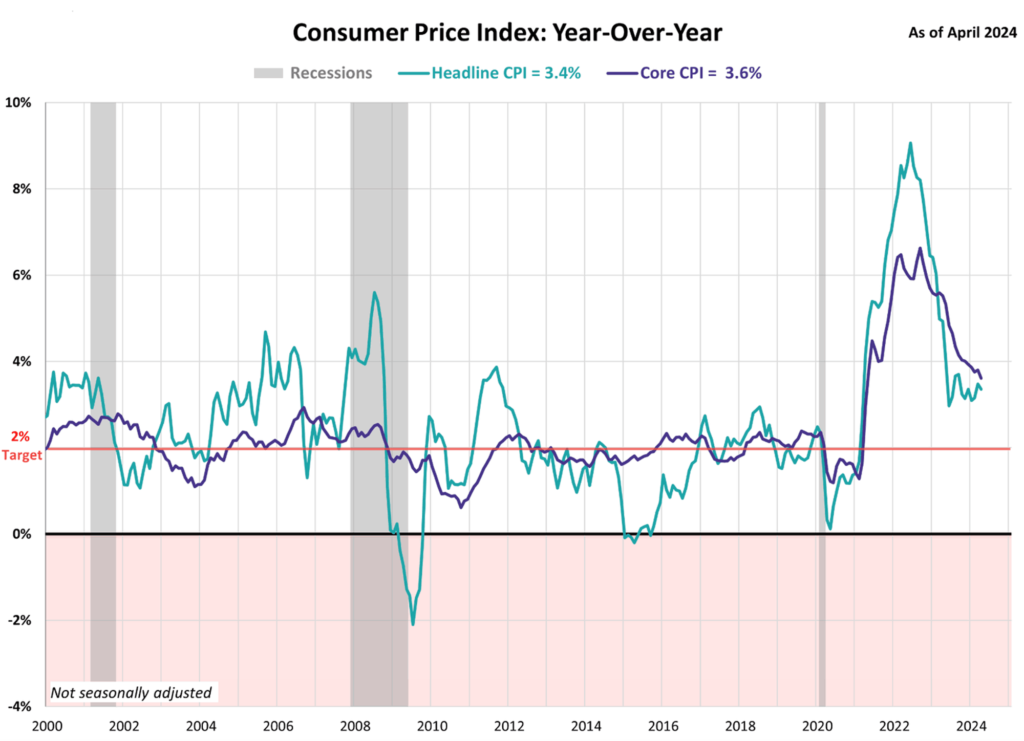
- 📈 In April, the Consumer Price Index (CPI) saw a 0.3% increase, while on a year-on-year basis, it rose by 3.4%.
- 💪🏻 Core CPI also experienced a 0.3% gain, with a year-on-year increase of 3.6%.
- 🏪 Retail sales remained unchanged, with core sales dropping by 0.3%.
Macroeconomic Analysis
US Inflation Rate Dips in Q2
Lower-than-expected inflation in April (0.3%) fueled hopes of an interest rate cut in September. A potential rate cut, which often coincides with increased investment in riskier assets like crypto, could further boost the market. This optimism was bolstered by data showing stable retail sales (excluding April). This suggests consumers, concerned about inflation, may be reducing spending at online retailers and car dealerships.
Year-on-year, the CPI rose 3.4% in April, down slightly from 3.5% in March. While inflation has fallen from its peak of 9.1% (June 2022), the slowdown appears to be easing. Over the past year (ending April), core CPI rose to 3.6%, the smallest increase since April 2021 (following 3.8% in March). However, the rising cost of living remains a key concern leading up to the election.
Other Economic Indicators
- Michigan Consumer Sentiment: In May, the University of Michigan consumer sentiment index fell sharply to 67.4, the lowest in six months, down from April’s 77.2. This decline was caused by ongoing inflation, high interest rates, and concerns over unemployment. Despite the decline, the index remains about 14% higher than a year earlier. Consumer spending, however, was relatively strong in the first quarter of 2024, fueled by high-income US citizens who benefited from rising home prices and stock portfolios. The US unemployment rate is at an all-time low of 3.9%, leading companies to offer higher wages to attract workers.
- Producer Price Index (PPI): The U.S. Producer Price Index (PPI) for final demand rose 0.5% month-over-month in April, surpassing the expected 0.2% increase. Nearly three-quarters of this rise is due to a 0.6% month-over-month increase in the index for final demand services, while prices for final demand goods increased by 0.4% month-over-month. Excluding food, energy, and trade services, the PPI rose 0.4% month-over-month. Over the past 12 months, the PPI increased by 2.2% year-over-year, marking the highest rise since April 2023. Prices for final demand less foods, energy, and trade services grew 3.1% year-over-year, also the largest increase since April 2023.
- Retail Sales: Retail sales flatlined in April after a modest 0.6% rise in March. However, year-over-year, retail sales remain positive, showing a 3.0% increase. Faced with higher prices, consumers are focusing on essentials and cutting back on luxuries. A Bank of America Institute report found that, despite worries about a weakening job market and rising property insurance costs, spending by low-income households grew faster than high-income households in April. Core retail sales (excluding autos, gas, building materials, and dining) dipped 0.3% in April, following a downwardly revised 1.0% gain in March.
BTC Price Analysis
Bitcoin ETFs have reached daily volumes close to $6 billion, returning to levels not seen since late March, as BTC prices hit new highs for May. A significant increase in buyers of 100-120k BTC calls for December 2024 has been observed, indicating growing confidence in the asset’s value. Meanwhile, institutional demand for the cryptocurrency remains strong, as we see major assets manager allocating more of the AUM into the spot BTC ETF.
This in turn made BTC surged out of its descending channel pattern, rising over 7% in a single day. It encountered resistance at the 0.618 Fibonacci retracement level, around 66,500. If BTC surpasses this resistance and establishes support in this area, it could prompt further price action beyond the Fibonacci golden pocket region.
Although the current green weekly candlestick is promising, the $67,000 to $69,000 zone is crucial to watch. If BTC can overcome this area and establish it as a support zone, the likelihood of a bull run increases significantly. The RSI is trying to rebound from just below the overbought zone but shows no clear signs of a bullish resurgence.
As is often the case when BTC moves in one direction, most altcoins follow suit. ETH has reclaimed the $3,000 level with a 3.6% increase over the past day. BNB has risen above $580 after a 3% gain. XRP and DOGE have also seen similar increases. We have seen other alt coins such as SHIB, AVAX, DOT, BSH and ADA surging between 6-8%.
The total crypto market cap has added roughly $150 billion on the 15th May, now exceeding $2.5 trillion. The next resistance is at 0.5 Fibonacci retracement line.

On-Chain Analysis
- 📊 Exchange: As the exchange reserve continues to fall, it indicates lower selling pressure. Net deposits on exchanges are low compared to the 7-day average. Lower deposits can be interpreted as lower selling pressure.
- 💻 Miners: Miners’ are selling holdings in a moderate range compared to its one-year average. Miner’s revenue is in a moderate range, compared to its one-year average.
- 🔗 On-Chain: More investors are selling at a profit. In the middle of a bull market, it can indicate a market top. Long term holders’ movement in the last 7 days was lower than the average. They have a motive to hold their coins. Investors are in a belief phase where they are currently in a state of high unrealized profits.
- 🏦 Derivatives: Long position traders are dominant and are willing to pay to short traders. Selling sentiment is dominant in the derivatives market. More sell orders are filled by takers. As OI increases, it indicates more liquidity, volatility, and attention are coming into the derivative market. The increasing trend in OI could support the current ongoing price trend.
- 🔀 Technicals: RSI indicates a neutral condition. Stochastic indicates a neutral condition where the current price is in a moderate location between the highest-lowest range of the last 2 weeks.
News About Altcoins
- Prices of Old School Memecoins GME and Roaring Kitty Soared Sharply. Despite a 20% drop in GameStop shares to $22.22 on May 17, the prices of two GameStop-themed memecoins, GME and Roaring Kitty, soared. GME rose about 10% to $0.007. Another coin, Roaring Kitty, jumped 42% to $0.008 after Keith Gill, who was linked to the 2021 GameStop stock surge, posted again on Reddit and after a hiatus of nearly three years.
News from the Crypto World in the Past Week
- Hong Kong Bitcoin ETF Underperforms Since Launch. Since launching, the Hong Kong spot Bitcoin ETF has seen disappointing performance, attracting only around $228 million in inflows. Trading activity has also been inconsistent, with a net outflow of 104.79 BTC (around $6.95 million) recorded on May 16th. The first day saw the highest inflow at 3,880 BTC, but performance has since stagnated. Total holdings across the three Hong Kong ETFs amount to 3,550 BTC, far lower than expected and representing only 1.28% of the assets held by the US Blackrock ETF.
Cryptocurrencies Market Price Over the Past Week

Cryptocurrencies With the Best Performance
- Fantom (FTM) +27,30%
- Chainlink (LINK) +23,11%
- Bonk (BONK) +22,13%
- Floki (FLOKI) +20,93%
Cryptocurrencies With the Worst Performance
- Worldcoin (WLD) -13,61%
- dogwifhat (WIF) -12,84%
- Ethena (ENA) -11,60%
- Toncoin (TON) -7,07%
References
- Jamie Redman, Lackluster Performance for Hong Kong Bitcoin ETFs Since Launch, bitcoin, accessed on 19 May 2024.
- MK Manoylov, Memecoins GME, Roaring Kitty spike even as GameStop’s stock tumbles back to earth, theblock, accessed on 19 May 2024.