
Stablecoins have emerged as a vital component of the cryptocurrency ecosystem, serving not only as a means of purchasing assets on exchanges, but also as valuable indicators for investors to perform on-chain analysis. So what are the stablecoin indicators that can be used as analytical tools? Find out more in the following article.
Article Summary
- 💸 Stablecoin analysis is an analytical method used among crypto investors to identify the movement of market trends or certain crypto assets.
- 🔭 Through stablecoin analysis, investors can identify demand for crypto assets, market sentiment, and investment opportunities.
- 🌟 Some popular stablecoin analysis indicators are stablecoin supply, stablecoin supply ratio, stablecoin dominance, and stablecoin exchange netflow.
What is Stablecoin Analysis?
Stablecoin analysis is an analytical method used among crypto investors to identify the movement of market trends or certain crypto assets. Stablecoins are a type of digital asset designed to maintain a stable or 1:1 value, which can be pegged to crypto assets or fiat money.
Stablecoins can also be considered a flow of funds that supports the growth of the crypto market. This is because investors use stablecoins to enter the crypto market and purchase various crypto assets. Therefore, by analyzing multiple stablecoin data, investors can gain insight into the market movements.
Why is Stablecoin Analysis Used?
Stablecoin analysts can be a helpful metric in analyzing potential market direction movements. Here are some of its uses:
- Identifying the demand for crypto assets. When stablecoins start flowing into exchanges, it indicates that investors are looking to buy crypto assets. Conversely, it suggests that investors are looking to sell their assets.
- Identifying the sentiment in the market. When stablecoins record net flows, market participants are bullish about the crypto market going forward. However, if the stablecoin records an outflow, market participants are bearish on the crypto market going forward.
- Finding opportunities to invest. By tracking the flow of stablecoins into or out of a particular crypto asset, investors can identify which crypto assets have the most demand and which may be undervalued.
You can learn more about stablecoins and their types in the following article.
Types of Stablecoin Analysis Indicators
In conducting stablecoin analysis, there are various indicators that investors can use. The following are some of the most commonly used stablecoin analysis indicators:
1. Stablecoin Supply
Stablecoin supply is an indicator that measures the total amount of stablecoins in circulation. Stablecoin supply is an important indicator because it shows the liquidity in the crypto market.
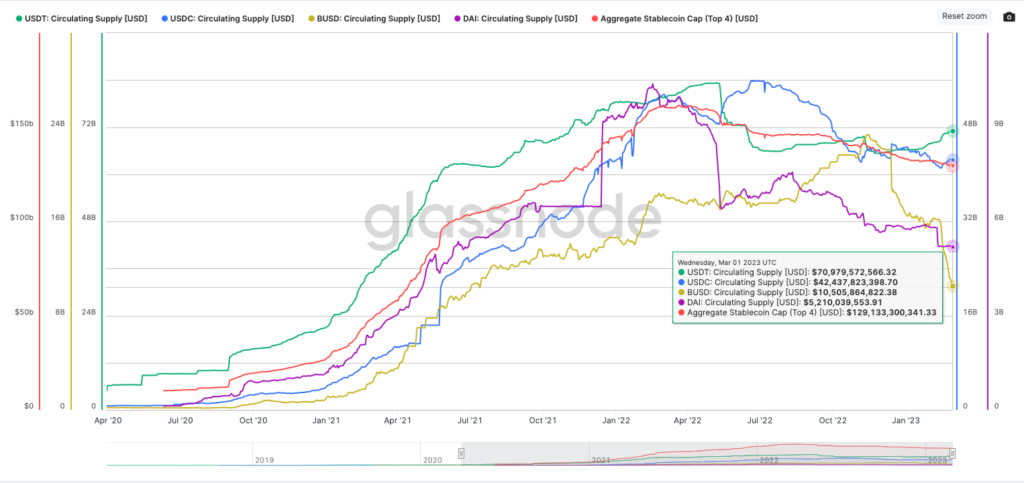
When stablecoin supply increases, it means that liquidity in the crypto market also increases. This can be a good sign. It makes trading more accessible, leads to higher adoption, and improves market stability and the overall efficiency of the crypto ecosystem. Increased stablecoin supply also indicates that investors are preparing to buy crypto assets, which could lead to a bullish trend.
2. Stablecoin Supply Ratio
The Stablecoin Supply Ratio (SSR) is a metric used to measure the buying power of BTC against stablecoins. SSR is derived from the ratio of the BTC market cap divided by the market cap of all stablecoins in BTC. The value of the SSR indicator can be interpreted as the amount of BTC supply that can be bought with the existing supply of stablecoins.
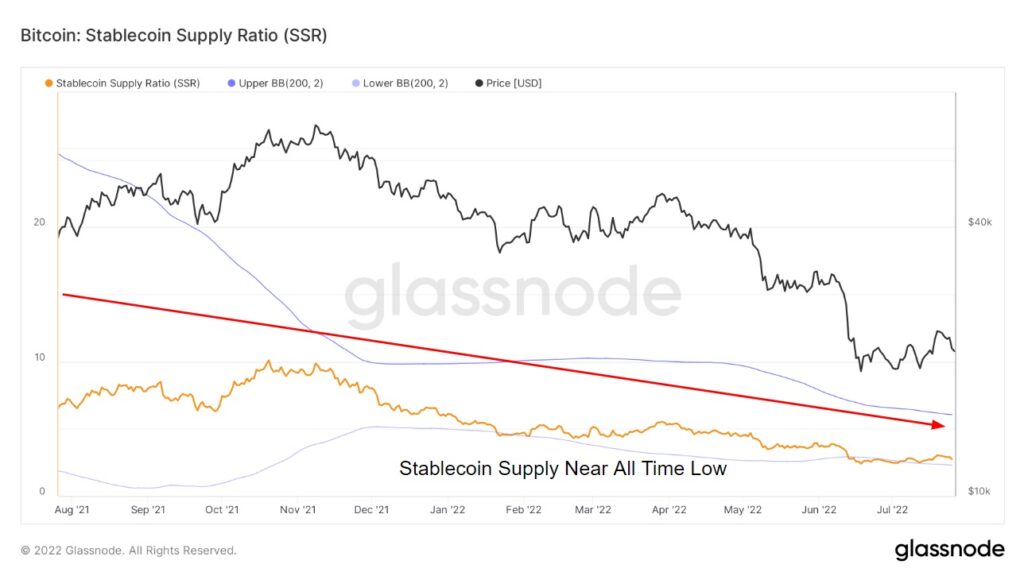
A low SSR indicates that the liquidity of the stablecoin is much higher than the crypto asset, in this case, BTC. This can be seen as a positive indicator as it shows that buying power is available to support an increase in the price of a crypto asset.
Conversely, a high SSR indicates less liquidity in the stablecoin than BTC. This means there is less buying power to support the crypto asset’s price. It makes crypto prices more volatile and prone to corrections, making it a negative indicator.
The main risk of stablecoins is the possibility of experiencing a depeg. Learn about depeg and its effects in the following article.
3. Stablecoin Dominance
Stablecoin dominance is an indicator that refers to the ratio between the market cap of a stablecoin and the market cap of other crypto assets. An increasing stablecoin dominance is interpreted as risk-off sentiment, where investors are risk-averse. As such, investors are shifting from volatile crypto assets to stablecoins. A high stablecoin dominance indicates a bearish market.
Conversely, decreasing stablecoin dominance is interpreted as risk-on sentiment, where investors are chasing riskier and more volatile assets. As such, they are selling their stablecoin to buy Bitcoin or altcoins. Low stablecoin dominance indicates bullish market sentiment.
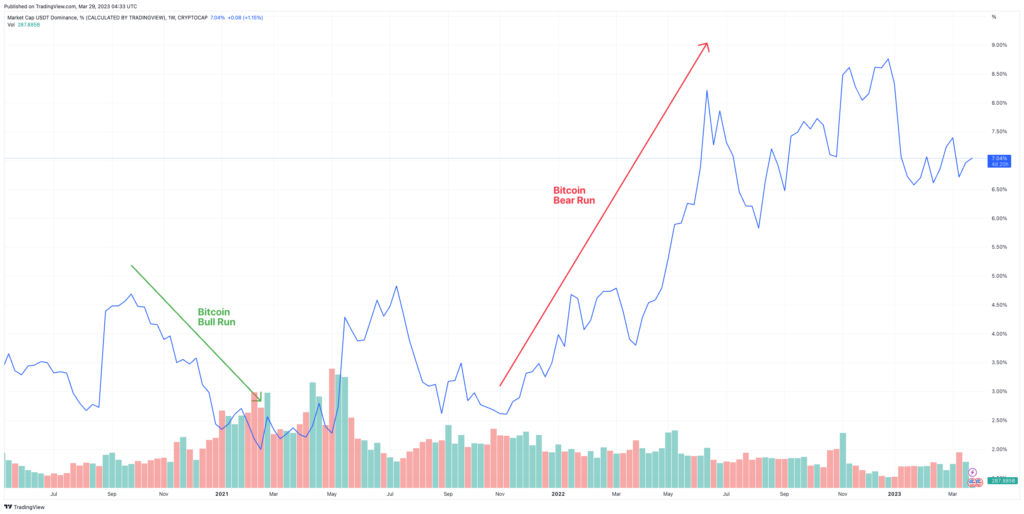
The chart above is USDT Dominance, the stablecoin with the largest cap at the moment. It can be seen that during the Bitcoin bull run (Sept 2020 – May 2021), stablecoin dominance decreased. This shows that investors are selling their stablecoins to chase BTC and Altcoins. Meanwhile, during the Bitcoin bear run (Nov 21 – Jun 22), stablecoin dominance increased. This means when BTC and Altcoins plunge, investors switch to stablecoins.
4. Stablecoin Exchanges Netflow
Another frequently used stablecoin indicator analysis is the stablecoin exchange netflow. This indicator shows whether stablecoins are inflowing or outflowing from crypto exchanges. Stablecoin exchange netflow is used to track investors’ buying or selling activity. It can also be used to identify the overall demand for crypto assets.
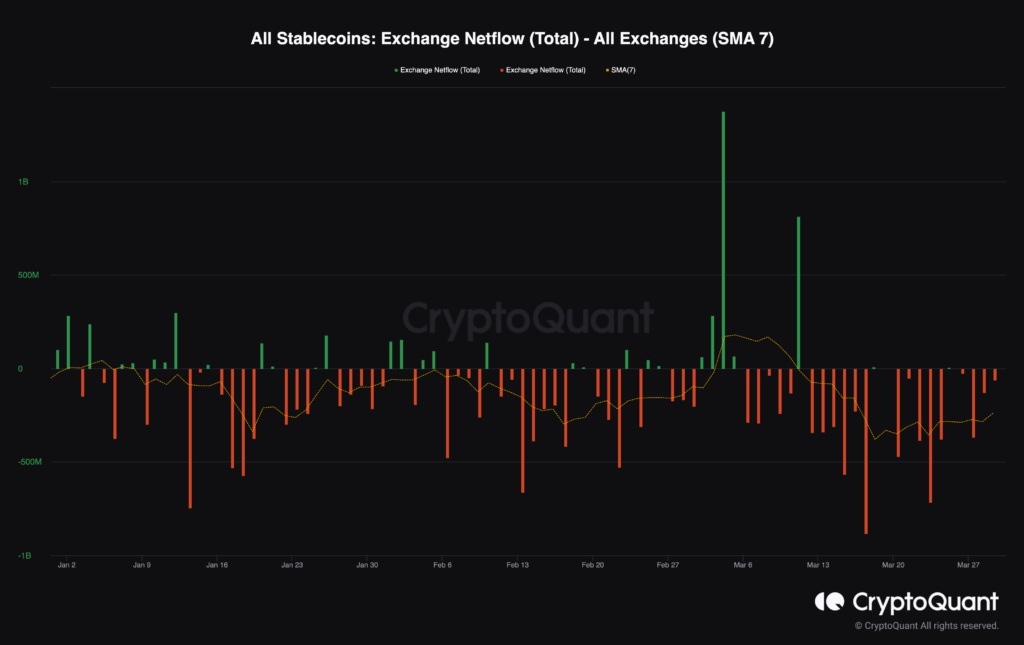
When stablecoin exchange netflow shows an inflow, market participants want to buy crypto assets. This can mean that the market is entering a bullish phase. Along with high demand, crypto asset prices are expected to rise.
However, if what happens is an outflow, it indicates market participants are selling their crypto assets. Inevitably, this condition signals that the market is or will enter a bearish phase. Weak demand for crypto assets can lead to a correction in crypto asset prices.
Exchange reserve is another indicator commonly used by investors. Actually, exchange reserve is the accumulated result of exchange inflow or outflow which naturally follows the indications that inflow or outflow has. Similar to Exchange NetFlow’s interpretation, an increasing trend in netflow indicates selling pressure and a decreasing trend indicates buying pressure
In addition to stablecoin analysis, learn about other indicators often used in the on-chain analysis in the following article.
Conclusion
As a tool, stablecoin analysis can help investors understand the crypto market dynamics. Indicators such as stablecoin dominance, stablecoin exchange netflow, SSR, and stablecoin exchange reserves, investors can gain insight into the market direction, demand for crypto assets and identify investment opportunities. Through stablecoin analysis, investors can make better investment decisions.
Despite its potential benefits, stablecoin analysis still has limitations. As with any other indicator, its accuracy is not always completely reliable. Moreover, the stablecoin indicator should not be used in isolation, as investors need to combine it with a variety of other indicators. By considering these factors, investors can utilize stablecoin analysis as a useful tool in their investment decision-making process.
Buy Crypto Assets in Pintu
Interested in investing in crypto assets? Take it easy, you can buy various crypto assets such as BTC, ETH, SOL, and others safely and easily. Furthermore, Pintu has subjected all its crypto assets to a thorough evaluation process, emphasizing the importance of prudence.
Pintu is also compatible with popular wallets such as Metamask to facilitate your transactions. Download Pintu app on Play Store and App Store! Your security is guaranteed because Pintu is regulated and supervised by Bappebti and Kominfo.
In addition to executing transactions, in the Pintu Apps, you can also learn more about crypto through various Pintu Academy articles updated weekly! All Pintu Academy articles are made for knowledge and educational purposes, not as financial advice.
Reference
Rafael Schultze-Kraft, Stablecoins’ Buying Power over Bitcoin, Glassnode, accessed on 29 March 2023.
Crypto Quant, Exchange In/Outflow & Netflow, accessed on 29 March 2023.
Sebastian Sinclair, Stablecoin Dominance At 9-Month Low After SEC Targets Binance Dollar, Blockworks, accessed on 29 March 2023.
Glenn Williams, Crypto Markets Analysis: Stablecoins Trend Lower Despite Bitcoin’s Recent Performance, CoinDesk, accessed on 30 March 2023.
Josh O’Sullivan, Analysis of on-chain stablecoin data reveals decline in USDT dominance, CryptoSlate, accessed on 30 March 2023.
Glenn Williams, Short-Term BTC Holders, Stablecoin Supplies Could Indicate Cryptos’ Future Price Direction, CoinDesk, accessed on 30 March 2023.