After days of drastic declines, the crypto market has finally seen a slight gain in the past week. Pintu’s team of traders has summarized the highlights of Bitcoin and Ethereum’s movement over the past week. We also bring you some important news from the world of altcoins and the crypto market. All the information in this market analysis is for educational and information purposes, not financial advice.
Market Analysis Summary
- ⚖️ Bitcoin finally moved sideways between $19-$21 thousand US dollars after briefly dropping to $17,600 US dollars. In addition, Bitcoin managed to rise from the 250-week MA line and found support.
- 💪 ETH briefly touched $880 US dollars and found support at the 300-week MA. Then, this week ETH found support in the 250-week MA at $1075 US dollars.
- 📉 Based on several indicators, ETH has not yet bottomed on its current -81% decline. The maximum expected drop for ETH is -94% at $260, with a possible bottom between late June and October 2022.
- 🔍 Signals from the Puell Multiple, NUPL, and MVRV-Z charts indicate that now is a good buying opportunity for BTC.
BTC and ETH Price Movement 19-25 June 2022
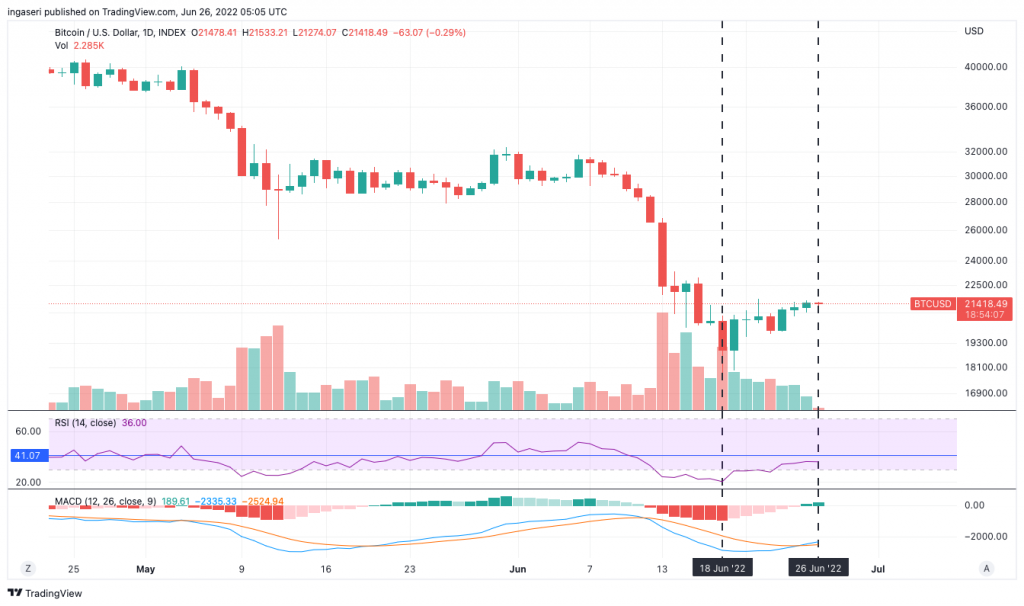
Over the past week, Bitcoin has finally started to move sideways between $19-$21 thousand US dollars. In the weekly chart, Bitcoin managed to rise from the 250-week MA line and found support.
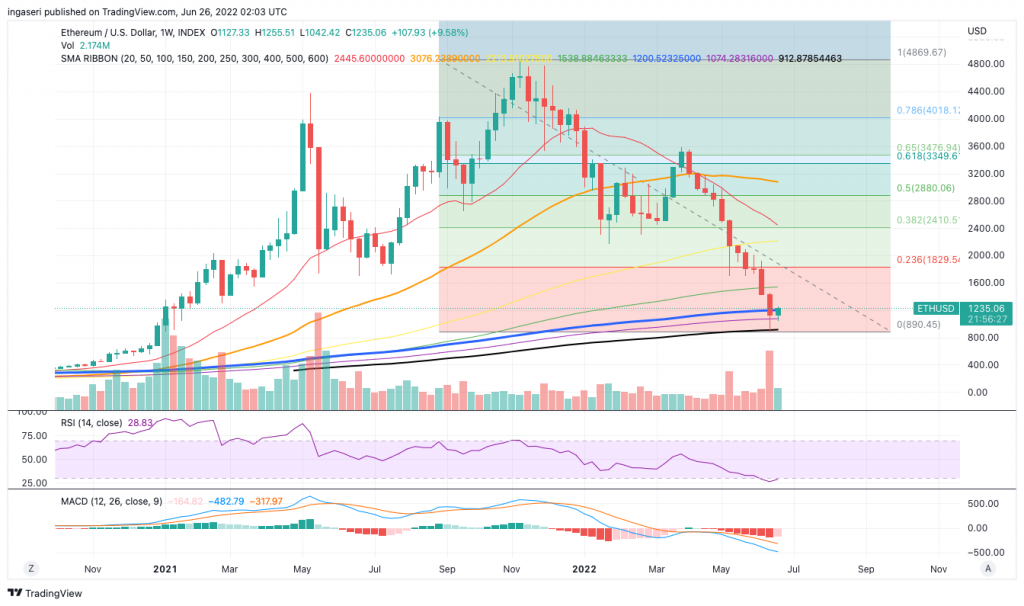
This week we’re going to talk more about Ethereum. Last week ETH touched $880 US dollars, where it found support at the 300-week MA. Then, something similar happened this week as ETH found support at the 250-week MA of $1075 US dollars.
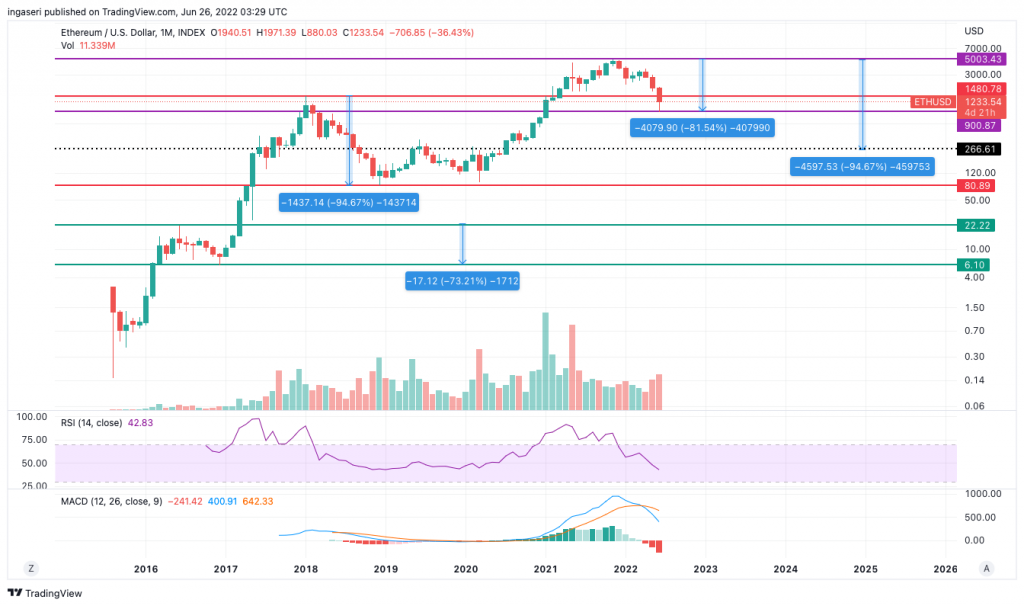
Turning to the monthly chart, we can see that since the beginning of ETH, we have experienced 2 major declines. The first drop reach the bottom in December 2016, ETH is down about 74% from the ATH/all-time high. The second drop bottomed in December 2018, -94% of its ATH. Assuming the same percentage decline, the maximum drop price for ETH is $260 US dollars. At the moment, we have fallen -81% from the previous ATH.
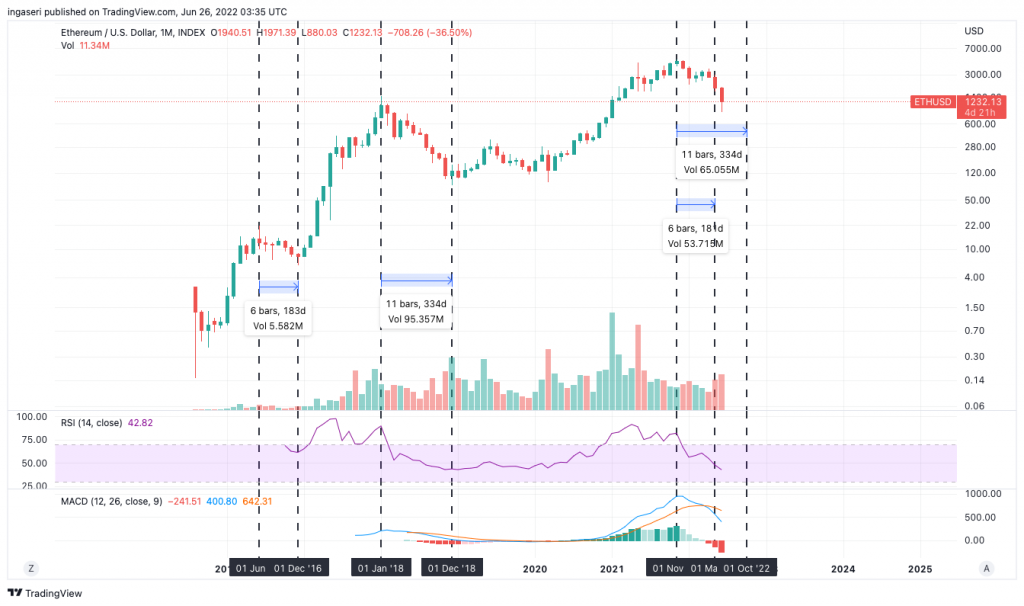
In 2016, there is a timeframe of 183 days between the peak and bottom phases. Furthermore, in 2018, there is a gap of 334 days to go through the same phase. Assuming we will experience the same timeframe, we might hit our next bottom between now and around October 2022.
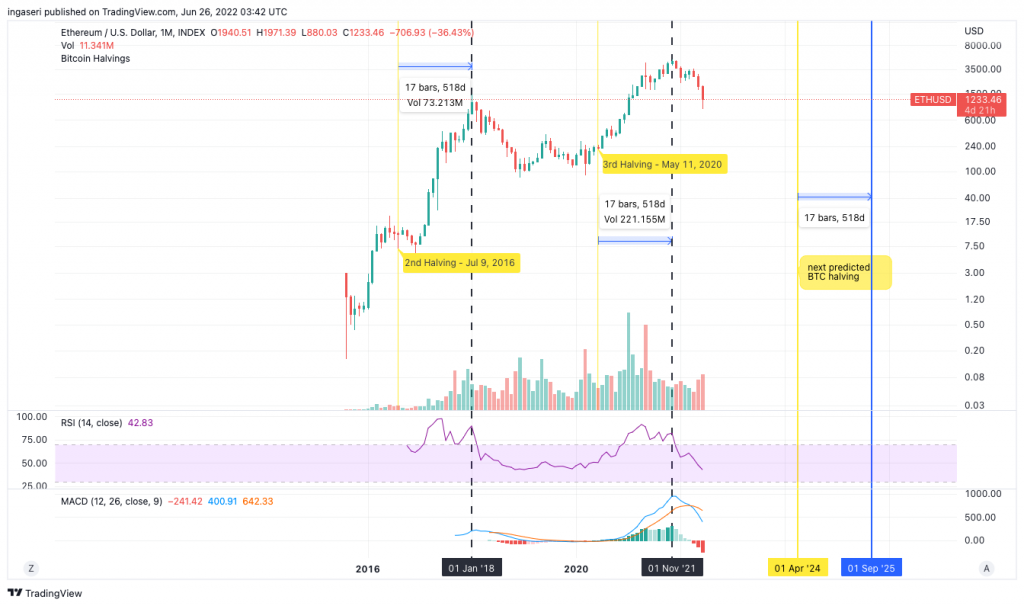
Moreover, we can notice that in the previous 2 events, ETH peaked exactly 518 days after the Bitcoin Halving. If we repeat this cycle, the next ETH top will occur in September 2025.
💡 What is Bitcoin Halving?
Halving event is the time when the reward for mining Bitcoin transactions is cut in half. Halving slows down the speed at which new Bitcoins enter the market.
Based on the two previous retracements, we can draw several conclusions:
- It is possible that ETH has not bottomed out at the current -81% decline. The maximum drop is -94% at $260 US dollars.
- The bottom range for ETH is between now (end of June) and October 2022.
- According to past data, the next top for ETH will occur in September 2025.
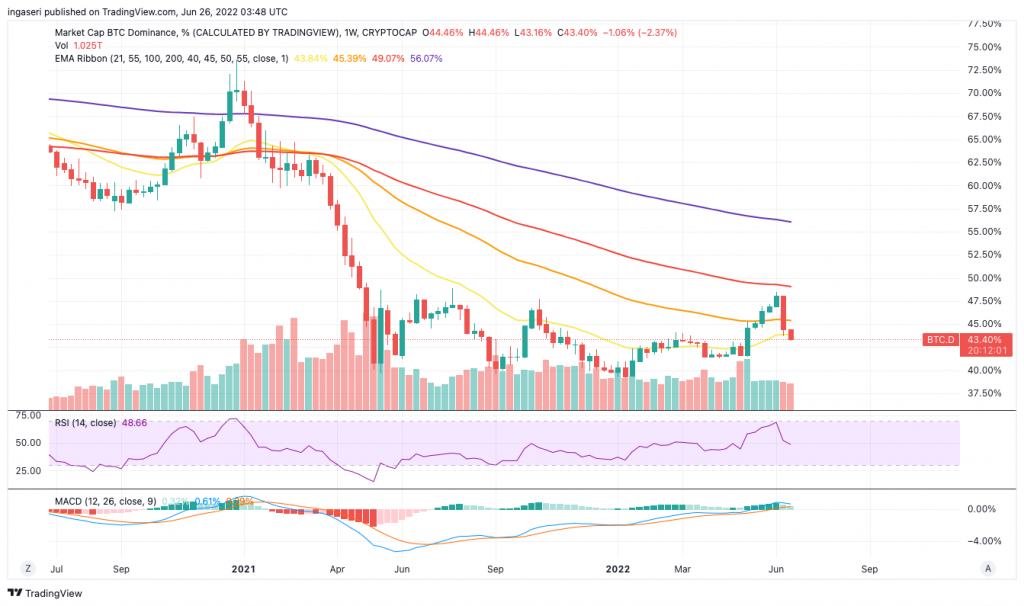
Bitcoin dominance fell for the second week in a row after rising from the 55-week EMA and dropping back down. Currently, it has support at the 21-week EMA.
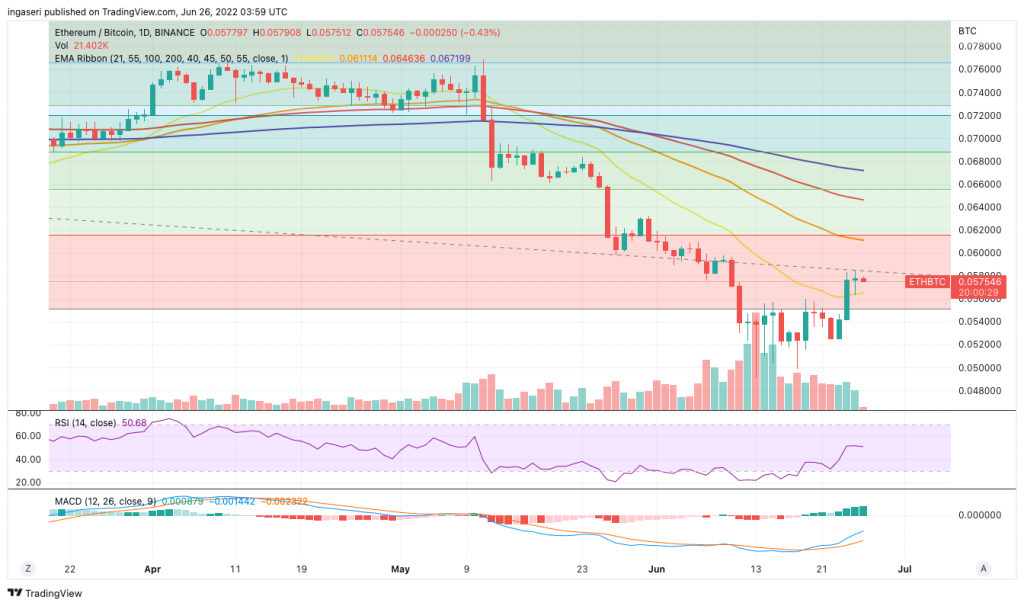
Last week, the ETH/BTC chart also managed to rise and find support at the 21-week EMA.
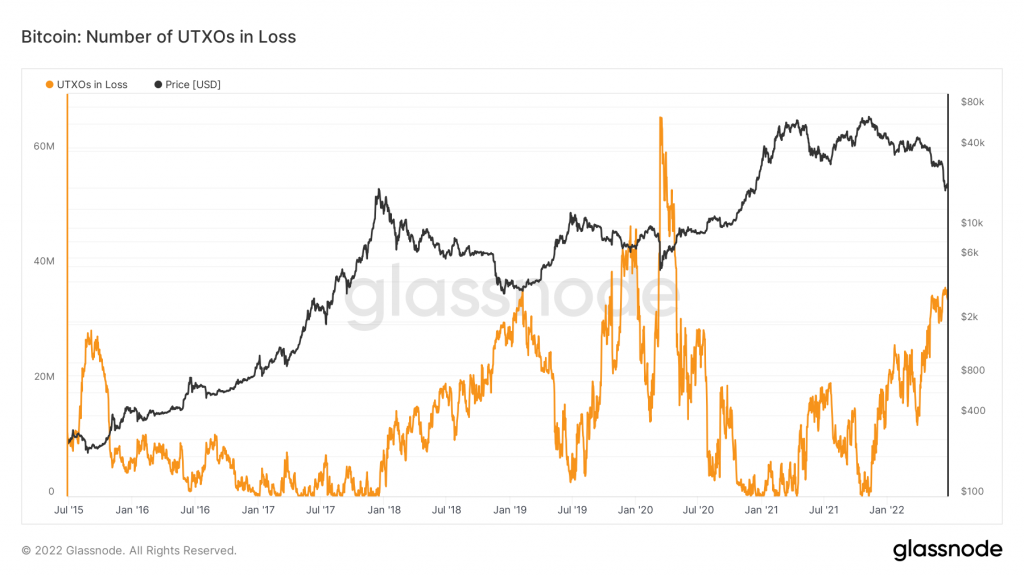
Let’s take a look at BTC UTXO losses (unspent transaction output) to explore more about BTC buying opportunities. The UTXO loss for BTC is the amount of unused transaction output whose price at creation is higher than its real-time price. Note that in March 2020, there was a loss of 65% and 44% in 2019. Currently, we are at 35%.
Some strong indicators for good buying opportunities: Puell Multiple, NUPL, and MVRV-Z. All three indicators show that now is a very good buying opportunity.
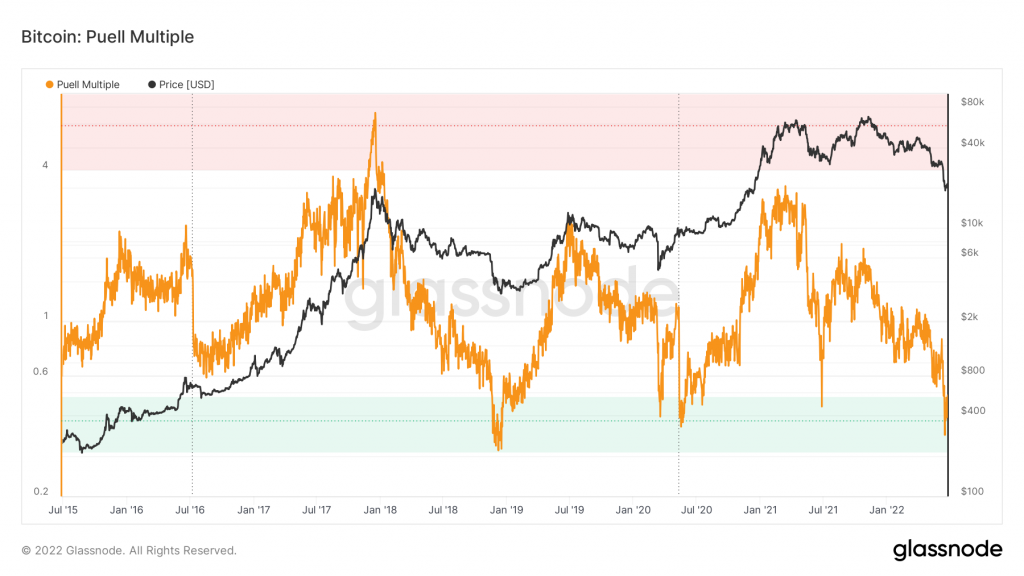
The Puell Multiple is calculated by dividing the daily issue value of bitcoin (in US dollars) by the 365-day moving average (MA) of the daily issuance value. We are currently in the green which has historically been a good buying opportunity for BTC.
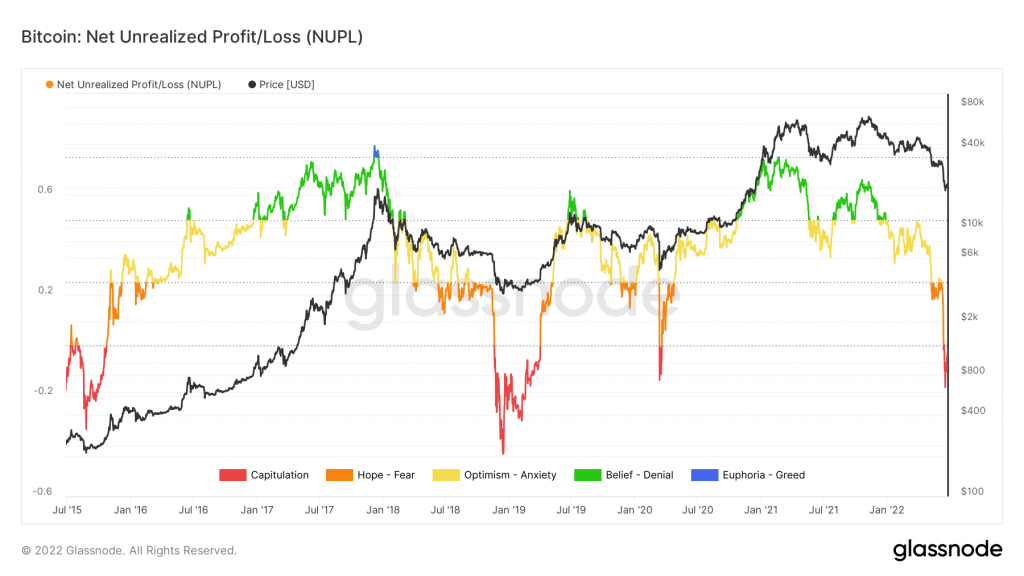
Net Unrealized Profit/Loss (NUPL) is the difference between Relative Unrealized Profit and Relative Unrealized Loss. Note that we are now in the capitulation zone, which has historically been a very good buying opportunity.
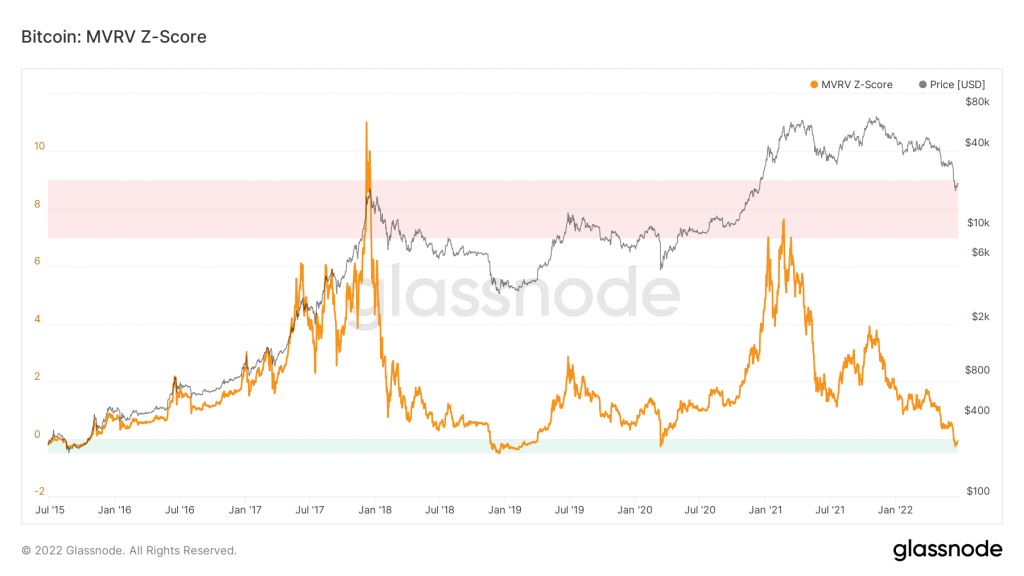
The MVRV Z-Score is used to assess when Bitcoin is over/undervalued relative to its “realistic value”. When the market value is significantly higher than its real value, it usually indicates a market peak (red zone), Conversely, if the market value is lower, it indicates a market bottom price (green zone). We are currently in the green zone.
On-Chain Analysis
Reserves from cryptocurrency exchanges have increased over the past week indicating higher selling pressure. However, this week’s total exchange net flows were lower than the last 7-day average, showing selling pressure has eased.
Miners sell their assets at a moderate compared to their one-year average. Furthermore, Miners’ earnings are in the mid-range, compared to the one-year average.
There is low buying pressure from institutional funds and ETFs. Institutional investors such as Grayscale also have relatively weak buying sentiments. In addition, the buying pressure of US investors on Coinbase is also weakening.
Investors are in capitulation. This indicates a decreased motivation for realizing losses which then reduces selling pressure. Furthermore, buying sentiment is dominant in the derivatives market. More buy orders are filled by takers. Meanwhile, RSI indicates neutral conditions.
News From the Altcoins World
- 📱 Solana Smartphone: Solana Labs announced that Solana will expand its platform to the mobile world by bringing Solana Mobile Stack (SMS) software kit to developers along with a decentralized app store. In addition, Solana also surprised everyone by announcing the Solana Saga, an Android-based smartphone that will be launched in early 2023. Solana Saga is Solana’s attempt to bring the world of crypto and Web3 into devices that can be widely adopted.
Other Important News From The Crypto World
- ☠️️ Harmony $100 million dollar hack: On June 23, 2022, Harmony’s Horizon Bridge was successfully hacked. The perpetrators managed to take $100 million US dollars in the form of Wrapped Ethereum (WETH), AAVE, SUSHI, DAI, USDT, and USDC which were then swapped into ETH. Currently, Harmony is offering a $1 million US dollar reward for the perpetrators to return all their funds and has promised to drop all criminal charges.
- ⚽ Ronaldo partnered with Binance: Christiano Ronaldo, one of the most popular athletes in the world, has just teamed up with Binance. Ronaldo will release several collections of NFTs containing his iconic moments via Binance’s NFT platform. The first Ronaldo NFT collection will be released later this year.
- 🤑 Goldman Sachs raises $2 billion from investors to buy Celsius: Some sources say Goldman Sachs led a $2 billion fundraising for the purchase of Celsius assets, although the lending platform has not declared bankruptcy. Citing Blockworks, Goldman Sachs in this case will act as a broker that helps buy Celsius assets. Even so, Goldman Sachs has not confirmed this news.
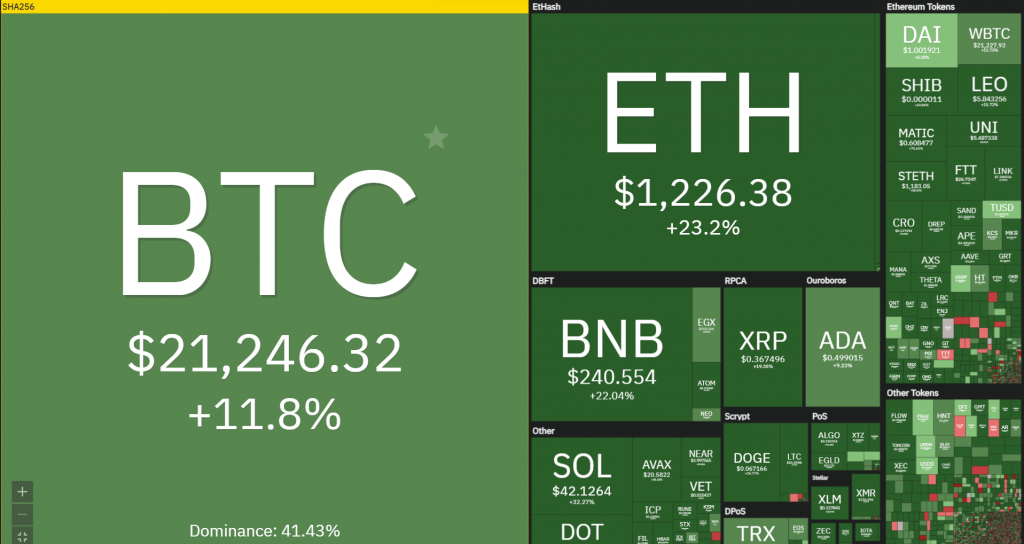
Cryptocurrency Performance Over The Past Week
References
- Andrew Hayward, Why Solana Is Going Big on Mobile—And Making a Smartphone, Decrypt, accessed on 27 June 2022.
- Mat di Salvo, Harmony Offers $1M Bounty After Discovering $100M Altcoin Hack, Decrypt, accessed on 27 June 2022.
- Kate Irwin, Soccer Superstar Cristiano Ronaldo Is Making NFTs for Binance, Decrypt, accessed on 27 June 2022.
- Tracy Wang, Goldman Sachs Leading Investor Group to Buy Celsius Assets: Sources, Coin Desk, accessed on 27 June 2022.