
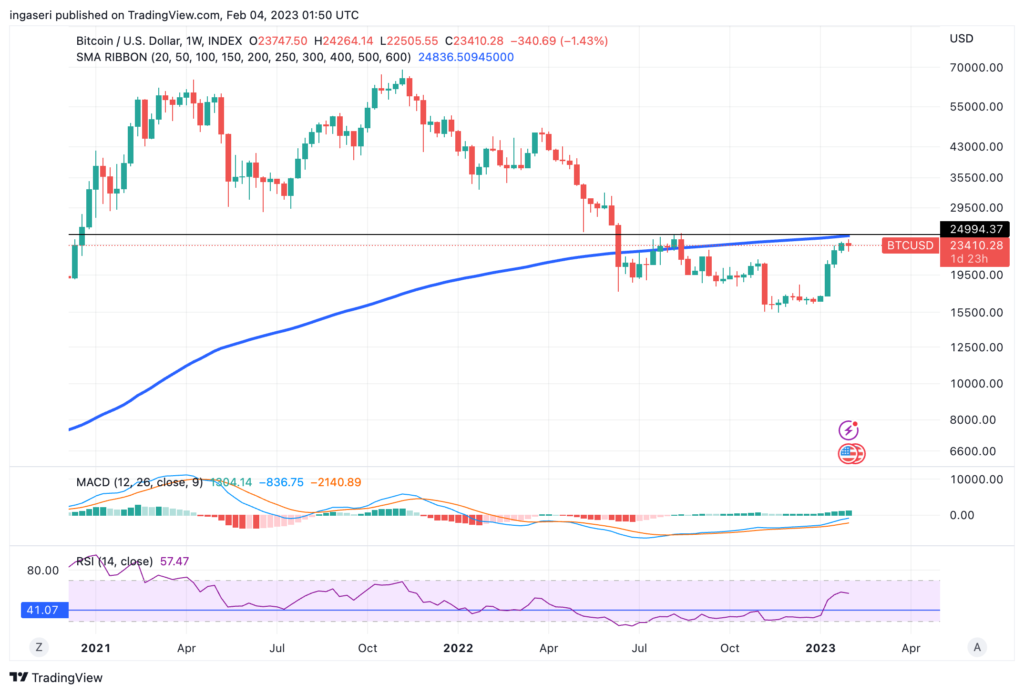
The Fed raised interest rates of 25 bps (0.25%) to 4.5%-4.75% last Wednesday. The stock market and crypto immediately responded positively to the news. However, the chart shows that BTC is not ready to punch through the heavy resistance at $25k.
As usual, the Pintu trader team has collected various data that analyze macroeconomics and the crypto market movement in the past week. However, you need to pay attention that all information in this market analysis is for education, not financial advice.
Market Analysis Summary
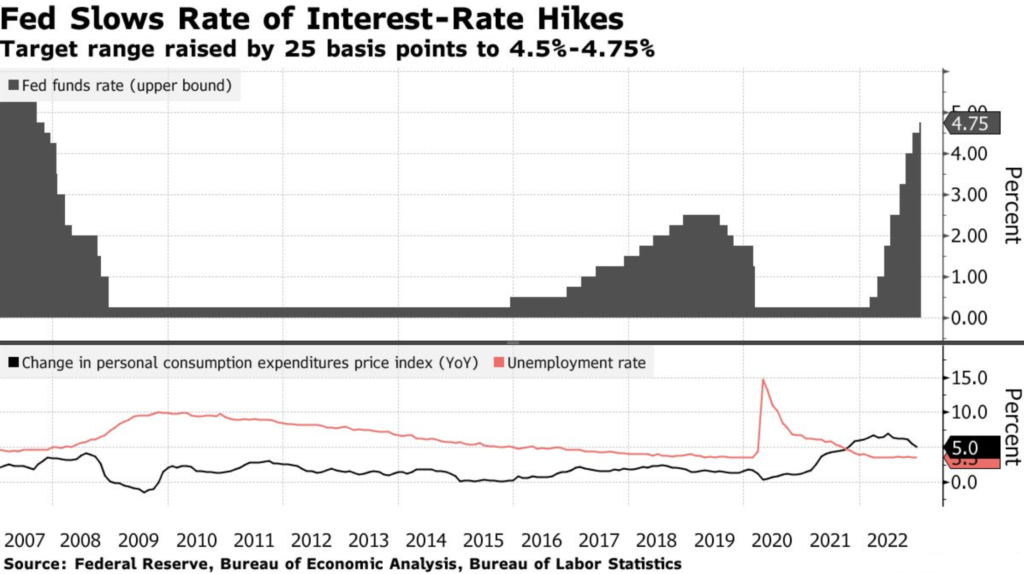
- 🏛️ The Fed increased interest rates by 25 bps to 4.5% -4.75% last Wednesday. The market estimates that there is a 97% possibility of a further 25 bps increase in March.
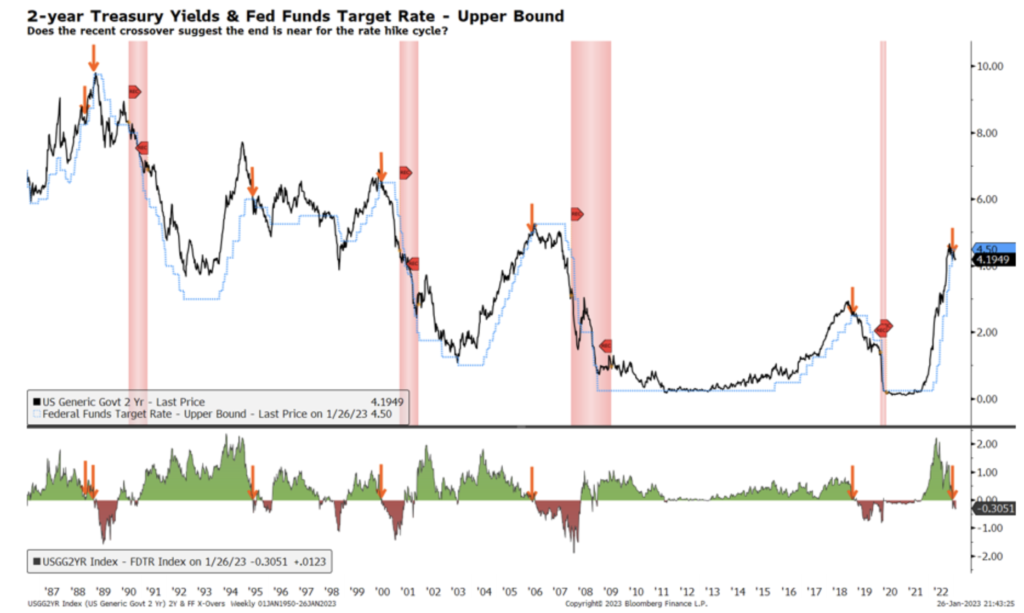
- 📊 There is a crossover on the 2-year treasury graph and the upper bound of the US interest rates. In the last five cycles, this crossover usually occurs toward the end of the rate hike cycle. This crossover is also a good sign for the equity market.
- 📈 Bitcoin experiences a rally after the announcement of The Fed, following the equity market. However, there was a slight correction after NFP (Non-Farm Payroll) data was released.
- ⚠️ BTC managed to penetrate the $24K to then slightly correct, signifying a failed breakout. The biggest obstacle is still 200 weeks MA on $25k.
- 🧠 The expectation is BTC will be ranging between $ 20K- $25k until we see confirmation that inflation is successfully tamed and economic tightening ends.
- ✅ Total Crypto Market Capitalization penetrates the $1 trillion figure. The market manages to find strong support in 200 weeks MA for 2 consecutive weeks. This is a positive first step.
Macroeconomic Analysis
The Fed raised interest rates by 25 bps to 4.5% -4.75% on Wednesday. The Chairman of the Fed, Jerome Powell, stated that there would be some more interest rate hikes before pausing economic tightening, even though their efforts to control inflation were seen to have slowed down.
The equity and treasury market experienced a post-announcement rally, even though the Fed indicates that it would not cut interest rates this year and there would be further hikes from the current target range. Powell recognizes that the Fed needs more data before declaring victory over inflation and restoring the inflation rate to 2% over time.
Additionally, economists believe that the 25 bps increase in March is almost certain, with the possibility of stopping at the target range of 4.75%-5%.
ECB (European Central Bank) and BOE (Bank of England) both raised market interest rates by 50bps, citing the expected reduction in future interest rates. It seems that most of the central banks expect a successful soft landing, especially if you look at the attitudes of The Fed, ECB, BOE, and BOJ(Japanese Bank).
Here is the economic calendar for February:

The main graph below shows the 2-year treasury yield curve (black line) and the upper bound of the Fed interest rate (blue line). Note that every time the two graphs cross each other, this indicates the end of the interest rate hike, while the red-shaded area represents the US recession period. The secondary graph below shows the spread between the two graphs. In the last five cycles, crossover usually occurs towards the end of the rate hikes cycle.
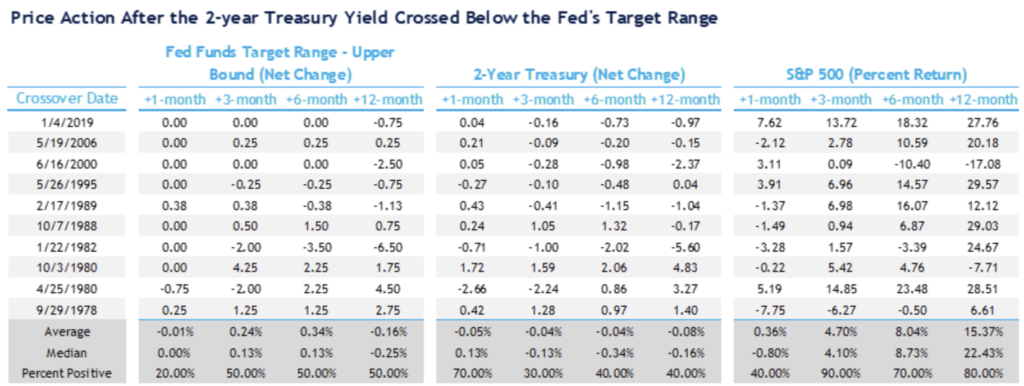
So what is the meaning of the crossover between these 2 graphics for the equity market performance? If we look at each crossover cycle, as shown below, we can see that historically S&P is struggling in the first month. However, better returns are seen over the course of 12 months. The average return for +3, +6, and +12 months is 5%, 8%, and 15%, respectively. Historically, the crossover is also a good sign for the equity market based on the returns following each signal for S&P.
Nearing the end of last week, the US labor department announced non-farm payroll data which increased by 517,000 during January (vs. 185,000 expectations and 260,000 in December). The unemployment rate decreased to 3.4%, the lowest number since 1969 (vs. 3.6% expectation and 3.5% in December). This unexpected headline number shows that the US economy remains robust, which indicates that the Fed will maintain a tight monetary policy stance.

According to the CME Fed watch Tool, the possibility of a 25 bps interest rate increase in March rose to 97% from 82.7% last Thursday. The possibility of an increase in 25 bps in May rose to 50.1% from 30% the previous day. Furthermore, the chance of an increase in interest rates in June, although still low, rose from 1.9% to 3.9%.

Bitcoin Price Analysis
BTC rose after the Fed’s rate hike announcement, following the equities market. It then takes a slight dip after the high non-farm payroll stats are announced. It broke the $24,000 price point followed by a reversal, a sign of a failed breakout. Despite high demand, the sellers have taken control of the current price action. The biggest hurdle is still the 200 weeks MA, at $25K. We still need to break above this historically strong support (now resistance) to confirm that we are ready for the bull run and that the bottom is over. Support is at $22,500 and $20,000 while resistance is at $24,000 and $25,000.
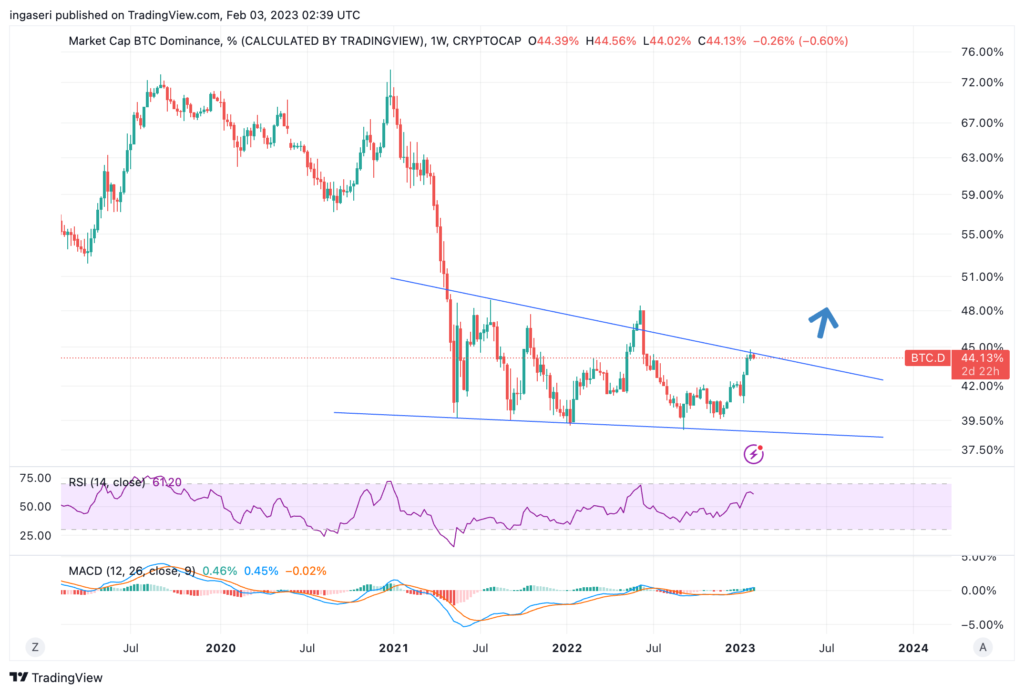
BTC dominance found its resistance at the upper bound of the falling wedge pattern that has been forming throughout these past months.
Below is BTC’s Bollinger Band. It measures volatility in BTC’s price action and can indicate when a move may be beginning (the lower band acts as a support) or when a move may be nearing its end (the upper Band as resistance). Notice that we are around the upper band. Can BTC rise up more than the current price rally? It just might, given the excitement of the market, we are seeing now. However, generally, deviation beyond the upper band tends to dip back into the band range.

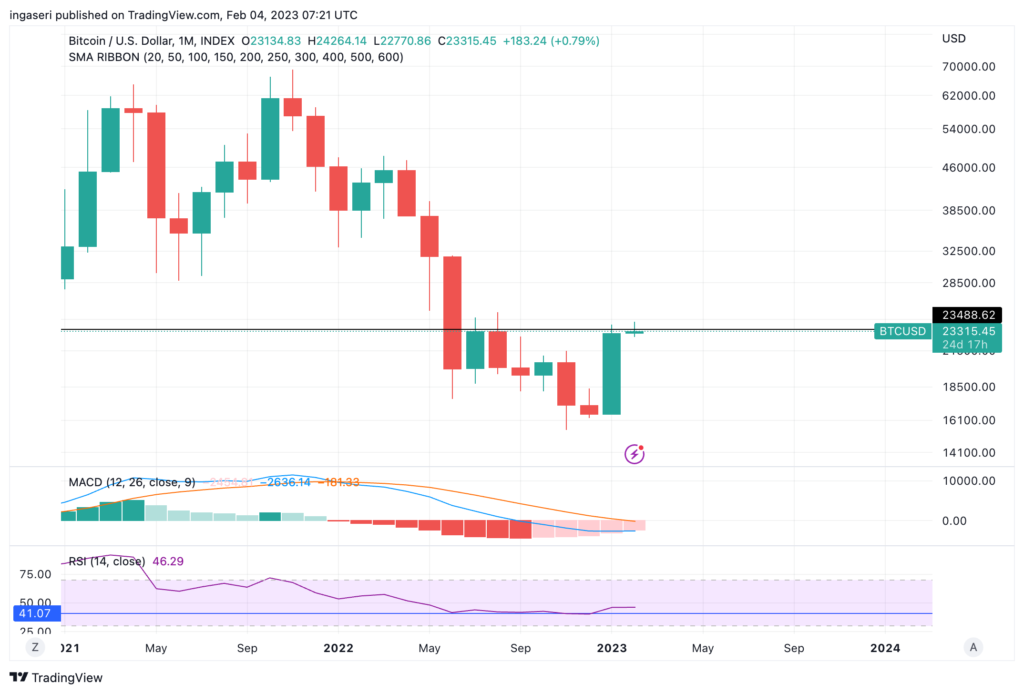
Also notice that there is a huge resistance in the monthly chart at $23,500. We closed the month of January below $23,500. Notice that the 21 weeks EMA lies in the 20K region. Expect BTC to hover around the 20,000-25,000 price range until we see confirmation of inflation tamed and the end of economic tightening.
Cryptocurrency Total Market Capitalization Analysis
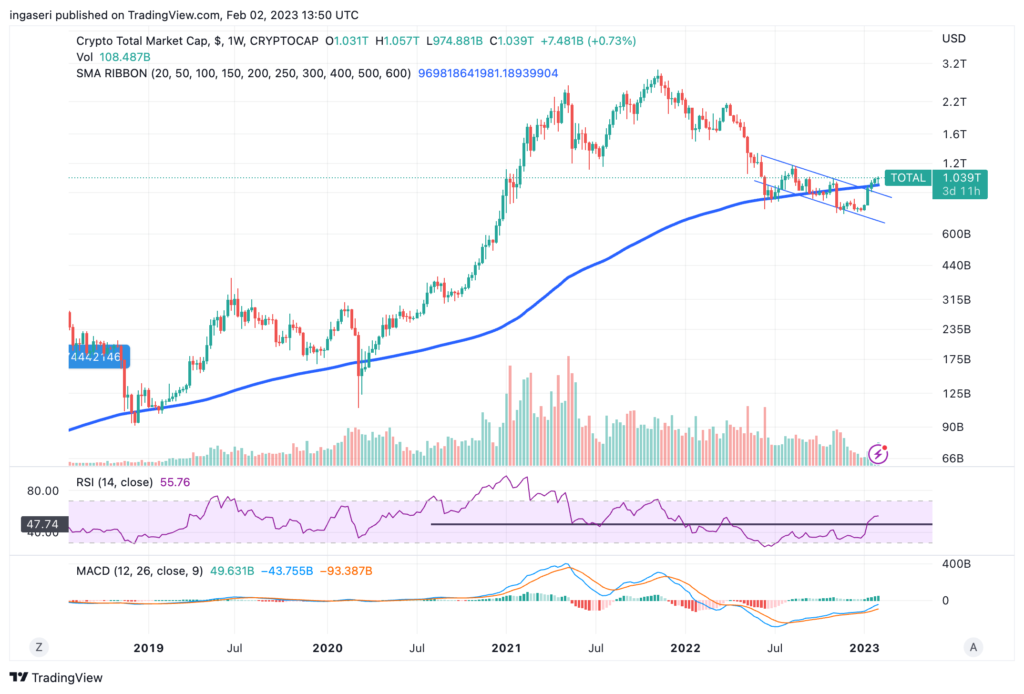
The total crypto market broke above the $1T mark last week. A good indicator is that we found support in the 200 weeks MA line for 2 consecutive weeks. This is an encouraging first step as we prepare for the market rally should BTC break above the 25K price point.
On-Chain Analysis
📊 Exchanges: As the exchange deposit increases, it can indicate increased selling pressure. Net deposit in exchanges is low compared to 7 days average. Lower deposits can be interpreted as lower selling pressure.
💻 Miners: Miners’ are selling holdings in a moderate range compared to their one-year average. Miners’ income is in a moderate position when compared to one year average.
🔗 On-Chain: More investors are selling at a profit. In the middle of a bull market, it can indicate a market top. Long-term holders’ movement in the last 7 days was lower than the average. They have the motive to hold their coins. Investors are in a fear phase where they currently have unrealized profits that are slightly more than losses.
🏦Derivatives: Long-position traders are dominant and are willing to pay short traders. Buying sentiment is dominant in the derivatives market. More buy orders are filled by takers. As open interest increases, it indicates more liquidity, volatility, and attention are coming into the derivative market. The increasing trend in OI could support the current ongoing price trend.
🔀 Technical: RSI indicates an overbought condition where 75.00% of price movement in the last 2 weeks has been up and a trend reversal can occur. Stochastic It indicates a neutral condition where the current price is in a moderate location between the highest-lowest range of the last 2 weeks.
Altcoin News
- 🔴 Optimism Upgrade Proposal: Bedrock, a massive overhaul in Optimism, has just entered a public proposal at Optimism Collective. Now, everyone can see the details of the Bedrock proposal. This proposal will later enter the voting stage once Optimism collects feedback from the community.
- 🌲 BNB Chain Greenfield Project: BNB Chain announced the latest project in its ecosystem, Greenfield, a decentralized data storage system. Greenfield is integrated with BNB Smart Chain so Dapps can use it directly.
- 👻 Fantom Plans for fUSD version 2: Quoted from the CoinDesk, Andre Cronje, one of Fantom’s lead DeFi developers, released an article about Fantom’s plan to create fUSD version 2. FUSD V2 will improve various deficiencies of version 1 which failed to maintain its dollar value several times.
- 🪙 Djed Stablecoin in Cardano: Quoted from The Block, decentralized stablecoin in Cardano, Djed, is finally ready after a year of development. Djed itself is a stablecoin with an over-collateralization model similar to DAI.
Crypto News
- Premier League Collaborates with Sorare: Sorare, a crypto fantasy football game, has just signed a 4-year agreement with the Premier League, England’s main football league. Quoted from CNBC, Sorare users can now buy premier league-licensed player NFT.
- Bitcoin NFT: Ordinals, a controversial project that allows users to store NFT-like assets in Bitcoin, is experiencing a dramatic increase in activity. Quoted from Decrypt, more than 1,000 NFT has been printed using Ordinals. This project causes controversy because it is in line with the ethos of Bitcoin.
- Ethereum Shanghai Upgrade Enters Testing: Quoted from Decrypt, Ethereum is testing ETH staking withdrawal feature through a testnet called Zhejiang. Zhejiang’s public testnet will provide time for validators to try and simulate the ETH withdrawal process from the Staking system. The Shanghai upgrade is will be live in March or April.
Cryptocurrency Market Performance Over the Past Week
Best Performing Crypto
- The Graph (GRT) +41,78%
- Immutable X (IMX) +31%
- dYdX (DYDX) +29,18%
- Optimism (OP) +27%
- Fantom (FTM) +19%
Worst Performing Crypto
- Aptos (APT) -16,42%
- Lido DAO (LDO) -8,94%
- Solana (SOL) -7,41%
- Axie Infinity(AXS) -6,49%
References
- Optimism on Twitter: “We’re extremely excited to put this historical proposal in front of the Token House. We see Bedrock as the culmination of years of R&D—and the next crucial step towards a modular, simplified, and performant multi-chain future. https://t.co/urk6U9aABj, Twitter, accessed on 6 February 2023.
- BNB Greenfield: A Decentralized Data Storage System and Economy, accessed on 6 February 2023.
- Shaurya Malwa, Fantom Blockchain to Release Version 2 of fUSD Stablecoin, Coin Desk, accessed on 6 February 2023.
- Vishal Chawla, The Block: Cardano’s decentralized stablecoin Djed goes live on mainnet, The Block, accessed on 6 February 2023.
- Ryan Browne, Premier League signs deal with NFT-based fantasy soccer game Sorare, CNBC, accessed on 6 February 2023.
- Jason Nelson, Bitcoin NFT Mints Are Rising—But So Are Transaction Fees, Decrypt, accessed on 6 February 2023.
- Sander Lutz, Ethereum Set to Trial Staking Withdrawals on Shanghai Testnet, Decrypt, accessed on 6 February 2023.