
The crypto market is moving positively due to the Ethereum Shapella upgrade and positive macroeconomic sentiment. The latest Consumer Price Index (CPI) data shows that The Fed’s inflation target is close to being met, indicating that the US central bank will likely reduce its interest rates soon. This raises questions about where the crypto and Bitcoin markets are headed, which we will explore in this comprehensive market analysis.
The Pintu trader team has gathered a lot of important information and analyzed the overall economic situation as well as the movement of the crypto market over the past week. However, it should be noted that all information in this Market Analysis is intended for education purposes only, not financial advice.
Market Analysis Summary
- 📈 CPI Index rose 0.1% in March and 5% from last year is still below expectations. Outside of food and energy CPI data, CPI increased by 0.4% and 5.6%, as expected. The global market is also getting tighter, pushing up oil prices.
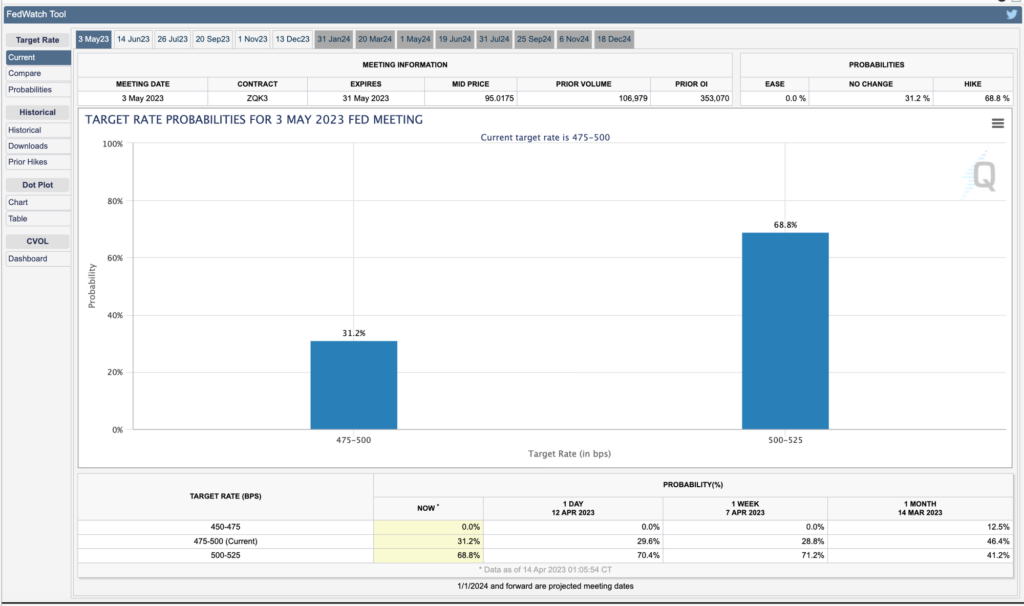
- 👁️ The market is anxiously waiting for a 0.25 percent interest rate hike at the Federal Reserve meeting in May. At the last FOMC meeting, a decrease in interest rate hikes was expected after the collapse of US banks.
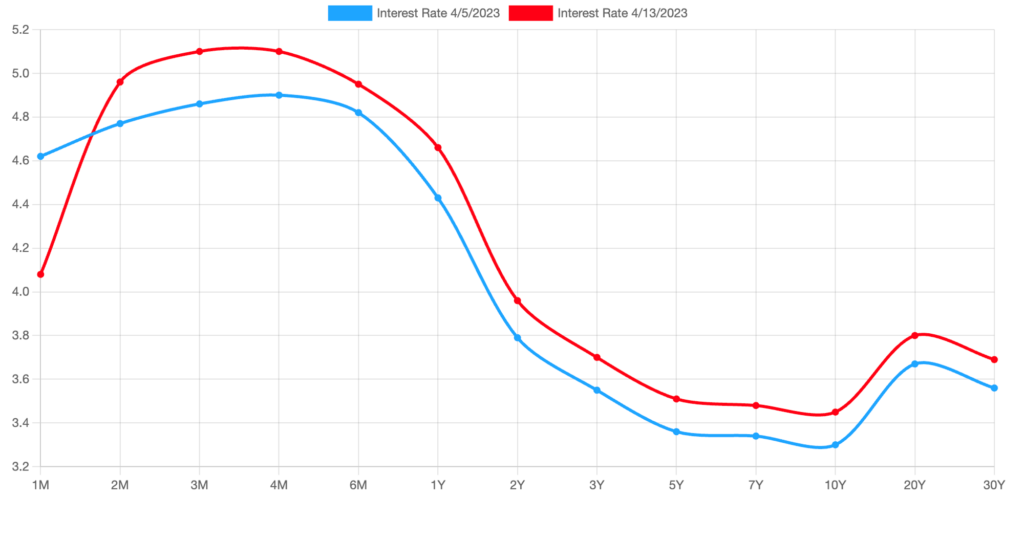
- 📉 Treasury Bill (US Government Bonds) rates in one month fell below 3.9% and the performance of the Dollar DXY index experienced its worst performance in 5 days since early January.
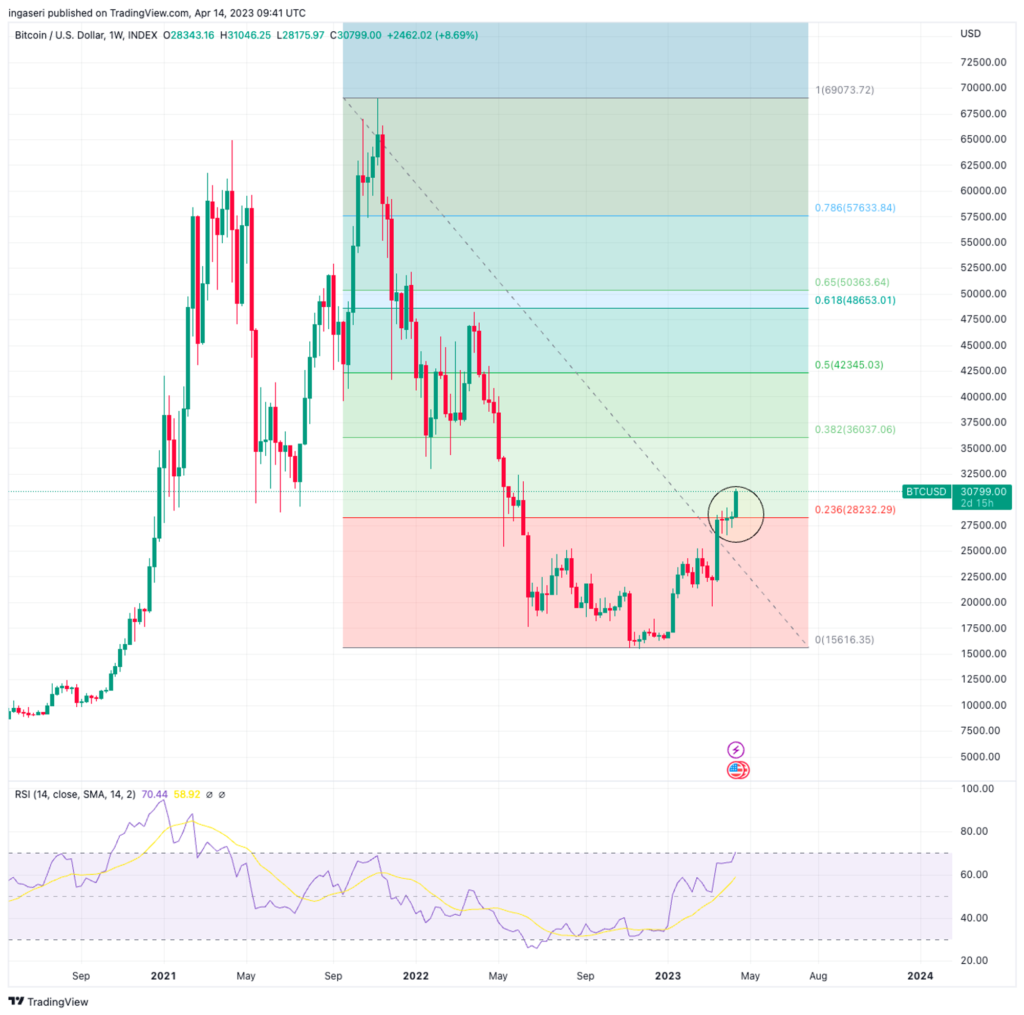
- 💪🏻 After 5 weeks, BTC managed to penetrate the Fibonacci retracement level of 0.236 on the weekly chart.
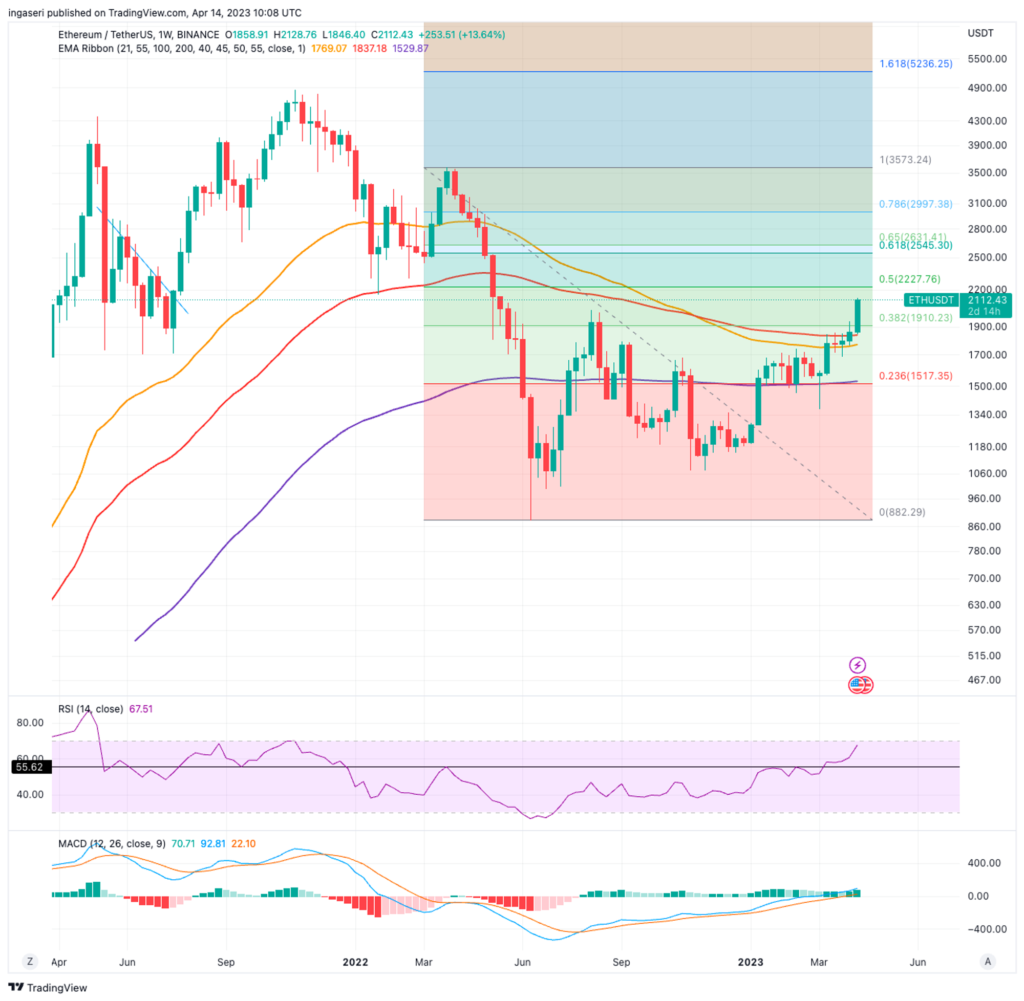
- 💰 ETH prices exceeded $2,000 for the first time since August 2022. The effect of the Ethereum Shapella upgrade.
- ✍🏻 The overall crypto market is currently facing a resistance line of the Fibonacci retracement of 0.236.
Macroeconomic Analysis
According to the Labor Department’s report on Wednesday, the consumer price index, which is a commonly used indicator of costs for goods and services in the U.S. economy, only rose by 0.1% for the month vs. consensus of 0.2%, and increased by 5% from the previous year, slightly lower than the estimated 5.1%. The core CPI, which excludes food and energy, followed expectations by increasing 0.4% and 5.6% on an annual basis. The impact of the Fed’s interest rate hikes was more evident in March, leading to a cooling of inflation.
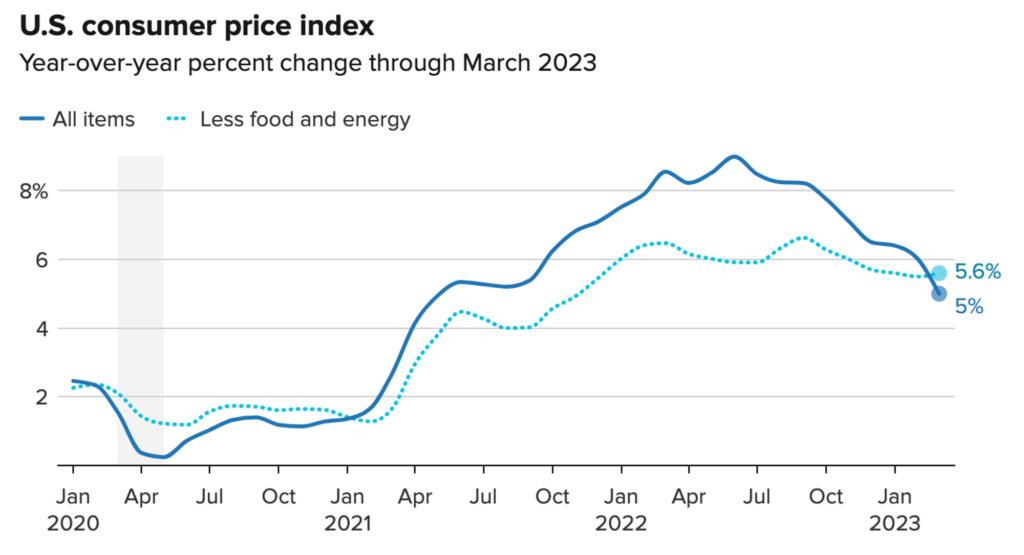
According to the data, although inflation remains above the level that the Fed deems appropriate, there are ongoing indications that it is slowing down. The policymakers aim for inflation to be around 2%, as it is a sustainable level of growth. The year-over-year rise in the consumer price index was the smallest since June 2021.
After the release of the report, stock market futures experienced a significant increase while Treasury yields decreased. The rate for the one-month Treasury bill dropped below 3.9%, as per the March data indicating the most significant decrease in wholesale prices in nearly three years. However, most other yields ended up higher.
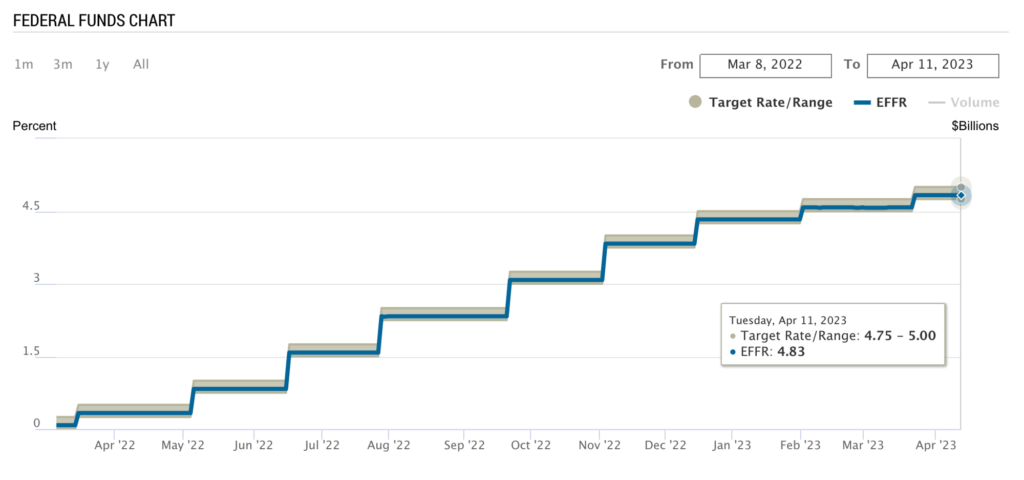
However, the markets still anticipated a 0.25 percentage point interest rate increase at the Fed’s May meeting, with a probability of 68%, as per the CME Group. This probability was slightly lower than the one observed on Tuesday. With the economic slowdown, consumer prices are expected to decrease, which should bring inflation closer to the Fed’s desired long-term target of 2%. The report is likely to receive a positive response from the markets, as investors will gain more confidence that the next Fed meeting may be the final meeting where the Committee raises the fed funds target rate.
Investors dealt a severe blow to the US Dollar last week, resulting in the DXY Dollar Index’s worst 5-day performance since early January. Last week’s key focus was on the latest US CPI and PPI reports, which revealed mixed results. Headline inflation surprisingly decreased, while underlying price pressures increased in March year-over-year. However, traders paid more attention to the wholesale inflation, which broadly declined for the same period.
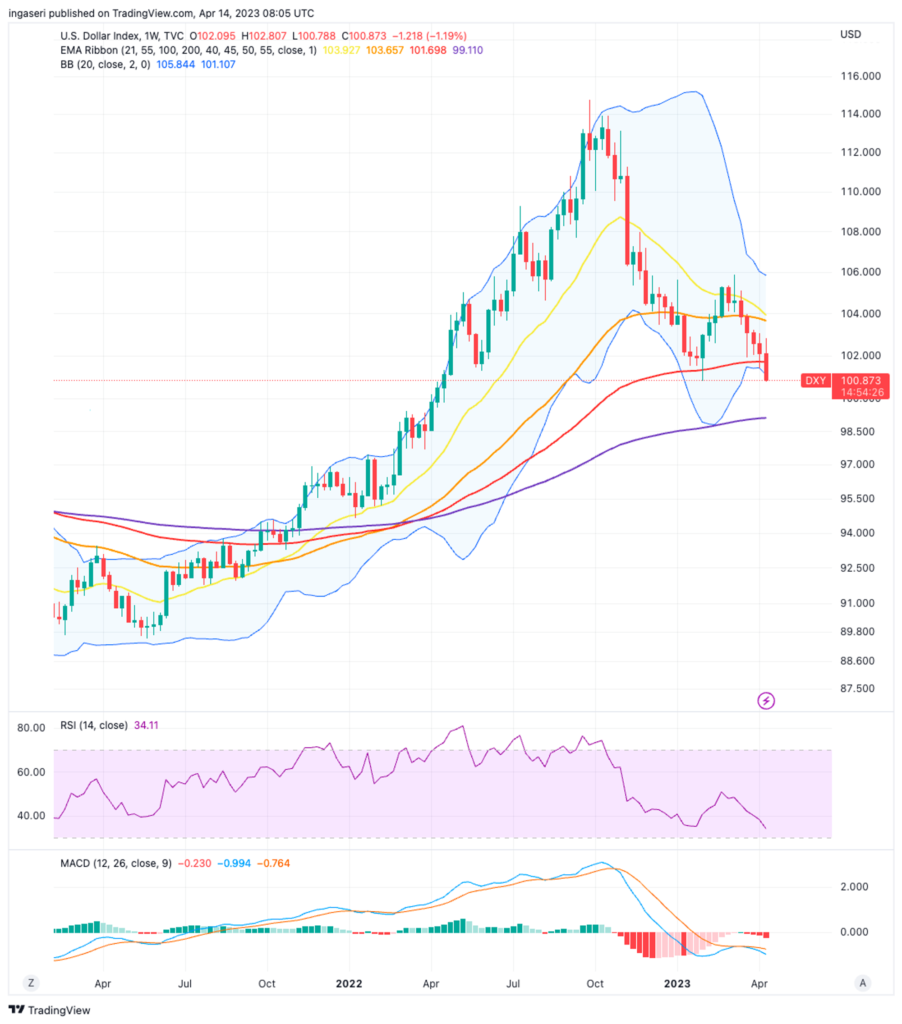
The data from last week indicates that price pressures could continue to decrease, which may prompt the Fed to end its tightening cycle soon. This narrative has been the driving force behind recent market movements, along with the growing expectation that the central bank will shift towards an easing policy later this year.
On the shorter term however, Fed officials are expected to continue raising interest rates next month, despite concerns from their advisers of a potential recession. Officials believe that they need to take action to control inflation, and are willing to take the risk despite warnings.
The minutes from their last policy meeting revealed that officials lowered their expectations for the amount they would raise rates after a series of bank collapses. Nevertheless, they increased the benchmark lending rate by 0.25% to a range of 4.75% to 5% to manage the threat of a credit crunch and to address the high level of price pressures indicated by incoming data. Even though they were warned of a “mild recession” by Fed staff advisers, officials agreed that additional policy measures might be necessary. According to the minutes, policymakers acknowledged that recent banking developments could lead to tighter credit conditions, negatively impacting economic activity, hiring, and inflation. Despite this, officials remain focused on the risk of inflation.
Another indicator that is justifying slower future Fed rate hikes is the recently announced lower US Producer Price Index (PPI) numbers. According to a report from the U.S. Bureau of Labor Statistics, the PPI for final demand decreased by 0.5 percent in March after remaining unchanged in February, beating expectations of 0.1%. and increasing by 0.4 percent in January, when adjusted for seasonal fluctuations.
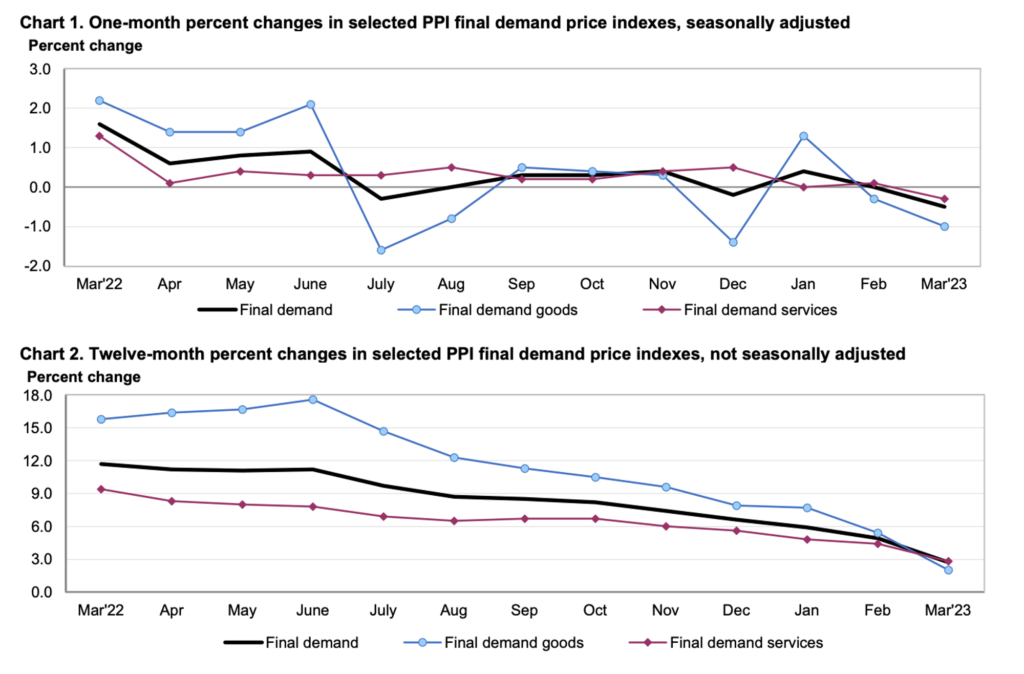
The unadjusted index for final demand increased by 2.7 percent over the 12 months ending in March. The drop in the index for final demand in March was mainly driven by a 1.0-percent decrease in prices for final demand goods, while the index for final demand services declined by 0.3 percent. Meanwhile, prices for final demand, excluding foods, energy, and trade services, rose by 0.1 percent in March, following a 0.2-percent increase in February. Over the 12 months ending in March, this index increased by 3.6 percent.
After approximately a year of the Fed’s aggressive campaign to cool inflation by raising its benchmark borrowing rate nine times, there are finally indications that the job market is beginning to soften. U.S. applications for jobless benefits rose to their highest level in more than a year, although it still remain at relatively low levels as compared to pre-covid levels. According to the Labor Department, 239,000 people filed for unemployment benefits in the week ending April 8, marking an increase of 11,000 from the previous week. The four-week moving average, which smooths out weekly fluctuations, also increased by 2,250 to 240,000, the highest since November 2021.
In commodities, oil headed for a fourth week of gains amid signs of a tightening global market. The depreciation of the US Dollar index contributed to the increase in demand for oil by investors holding currencies other than the US dollar, as a weaker greenback made oil relatively cheaper. Additionally, there were positive indications of an improvement in demand from China, which is the largest importer of crude oil and its derivatives. This was evidenced by the substantial increase in China’s crude oil imports in March, which surged by 22.5% compared to the same period last year, and reached their highest level since June 2020, according to the data released by the country on Thursday.
BTC & ETH Price Analysis
This week, BTC finally succeeded (after 5 weeks) to break above the 0.236 Fibonacci retracement level on the weekly chart. After positive macroeconomic data and smooth ETH’s shanghai upgrade, BTC experienced an impressive 9% gain WoW. We need to take note that the market condition right now is overbought and that we might experience a short-term correction soon, which is healthy and necessary for the next bullish rally. Spot volume also remains low, suggesting low bidding despite the milestone, but the risk of a pronounced drop is relatively low.
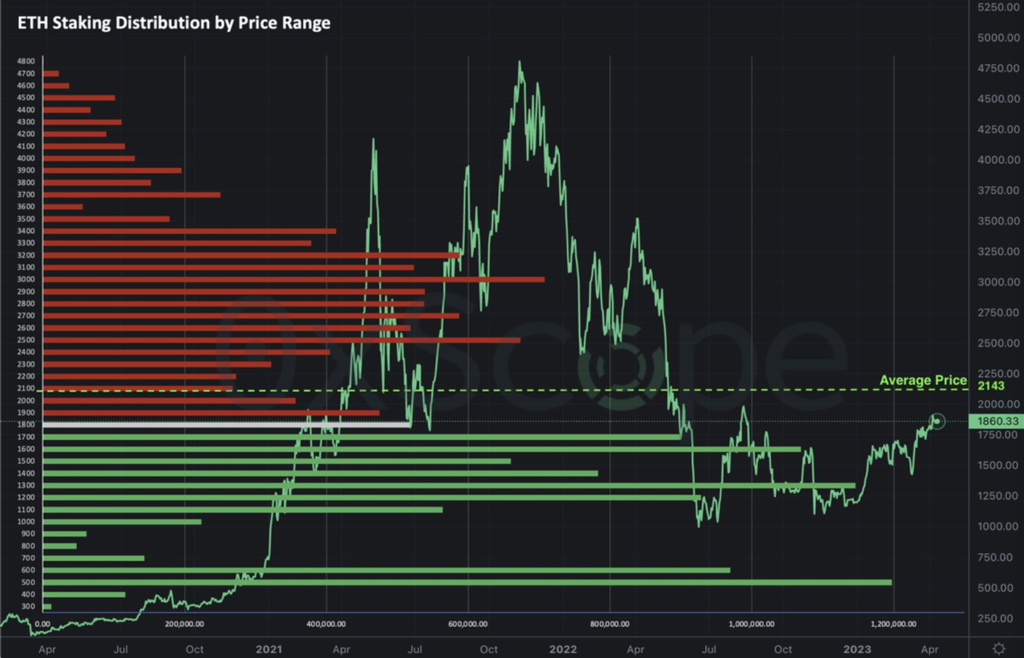
ETH stole the limelight after its successful ETH’s Shanghai upgrade, crossing the $2,000 mark for the first time since August last year. It outperformed BTC and most of the altcoins. The momentum of ETH staking withdrawals is increasing, but contrary to the expectations of many, it has not triggered a significant sell-off after the upgrade. It was found that 60% of staked ETH was held at a loss, indicating that the selling pressure on ETH would be relatively low following the implementation of the Shanghai upgrade.
Furthermore, it was observed that most of the withdrawals were made by addresses that only withdrew their rewards and not their entire stake. Based on on-chain data, the amount of ETH that has been withdrawn is very small, resulting in a mere -0.25% change in staked ETH.
Notice that on the weekly chart, ETH managed to find support at the 55 weeks EMA and broke through the 100 weeks EMA. It has gained an impressive 14% over the week. The market has been experiencing a continuous surge, causing ETH to become slightly overbought, thus increasing the probability of a price correction in the short term. It’s worth mentioning that ETH’s RSI is only two points away from its overbought level of 70.
The total crypto market is facing its 0.236 Fibonacci retracement resistance line as shown below. The total crypto market have been under this resistance line since May last year.
On-Chain Analysis
- 📊 Exchange: As the exchange reserve continues to rise, it indicates higher selling pressure. Net deposits on exchanges are low compared to the 7-day average. Lower deposits can be interpreted as lower selling pressure.
- 💻 Miners: Miners’ are selling holdings in a moderate range compared to its one-year average. Miner’s revenue is in a moderate range, compared to its one-year average. More investors are selling at a profit. In the middle of a bull market, it can indicate a market top. Long term holders’ movement in the last 7 days was lower than the average. They have a motive to hold their coins. Investors are in an anxiety phase where they are currently in a state of moderate unrealized profits.
- 🏦Derivatives: Long position traders are dominant and are willing to pay to short traders. Buying sentiment is dominant in the derivatives market. More buy orders are filled by takers. As open interest increases, it indicates more liquidity, volatility, and attention are coming into the derivative market. The increasing trend in OI could support the current ongoing price trend.
- 🔀 Technicals: RSI indicates a overbought condition where 74.00% of price movement in the last 2 weeks have been up and a trend reversal can occur. It indicates a overbought condition where the current price is close to its high in the last 2 weeks and a trend reversal can occur.
News about Altcoins
- Successful Ethereum Shanghai Upgrade! On April 13th, Ethereum completed the Shapella upgrade at block height 6209536, and validator withdrawals are now enabled. Almost 30 hours after the Shanghai upgrade, around 240,000 ETH were withdrawn and nearly 100,000 ETH were deposited. Within less than 24 hours, ETH rose by 10%, surpassing $2,100. Other tokens, such as RADIX, RPL, LIDO, and ARB, also experienced significant increases.
- Solana Smartphone Set to Launch and Be Sold on May 8th, 2023. Solana Labs announced that the encrypted Saga phone will be sold to the public for $1,000. The phone has 512GB of storage, dual rear cameras, a 6.67-inch OLED screen, a fingerprint scanner, and runs the latest Android operating system. The unique feature of Saga is the “Solana Mobile Stack” (SMS), a series of special additional components that integrate crypto currency utilities into the phone’s software and hardware, including the exclusive Solana app store.
Other News from the Crypto World in the Past Week
- Hong Kong SFC Demands DeFi Projects Have Licenses and Regulation. Following the launch of the US DeFi risk report, Cai Zhonghui, a Hong Kong Securities Regulatory Commission official, said that DeFi projects need to be regulated by the SFC, and automated trading services are also under SFC supervision. It is said that many DeFi projects are not decentralized, and a small number of people or officials control most of the tokens, and the SFC must disregard statements and study substantial content.
- Facebook and Instagram Stop Supporting NFTs Starting April 11th, Instagram stated that it will no longer be connected or associated with third-party digital wallets; Instagram will begin deleting digital collection data in the system, including wallet addresses.
Cryptocurrencies Market Price Over the Past Week
Cryptocurrencies With the Best Performance
- Injective Protocol Price (INJ) +63,2%
- WOO Network (WOO) +50,51%
- Arbitrum (ARB) +37,67%
- Rocket Pool (RPL) +32,02%
Cryptocurrencies With the Worst Performance
- Quant (QNT) -3,17%
- PancakeSwap (CAKE) -1,76%
- Tron (TRX) -1,6%
- Stacks (STX) -1,03%
References
- Terencechain, Ethereum completed the Shapella upgrade, Twitter, accessed on 17 April 2023.
- Danny Nelson, Solana’s Crypto-Ready ‘Saga’ Smartphone Goes on Sale May 8, Coin Desk, accessed on 17 April 2023Rahul Nambiampurath, Hong Kong DeFi Crowd Deflated After SFC Official Suggests Regulation, beincrypto, accessed on 17 April 2023
- Instagram, Digital collectibles on Instagram is winding down, accessed on 17 April 2023