
BTC broke a downward trend that has historically kept prices down for months, which could be seen as a positive sign for the cryptocurrency market in the face of a potential recession caused by the combination of decreasing oil output and a contracting US economy.
The Pintu trader team has collected various data that analyze macroeconomics and the crypto market movement in the past week. However, kindly pay attention that all information in this market analysis is for education purposes only, not financial advice.
Article Summary
- 🛢OPEC+ cuts oil production which causes higher oil prices, and has the potential to trigger inflation.
- ⚠️ The number of job vacancies in February fell to 9.9 million from 10.6 million. The United States experienced an economic contraction that occurred when economic activity decreased.
- 📊 BTC closes above macro downtrend for the third time in history. Breaking this trend usually results in long-term growth, as seen in 2015 and 2019. However, BTC is still far from the leading indicator of long-term growth, the 20-month MA.
Macro Analysis
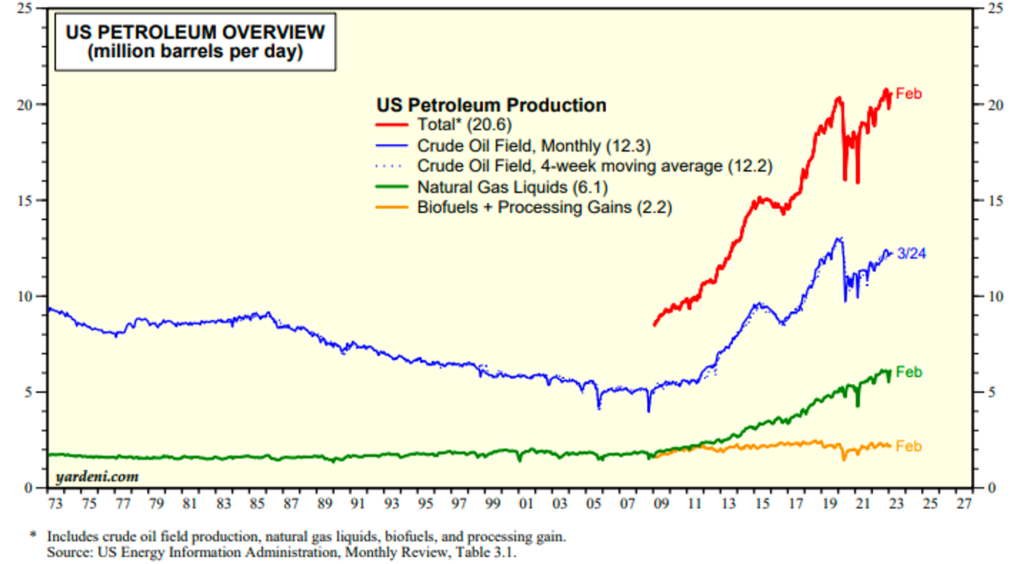
On Monday, both Brent and WTI experienced a surge of over 6% in response to the announcement made by Saudi Arabia and other members of OPEC+ on Sunday. They stated that production cuts totaling approximately 1.16 million barrels a day would be made starting in May. Additionally, Russia declared that it would prolong its March cut of 500K barrels a day until the end of the year. OPEC+ comprises the Organization of the Petroleum Exporting Countries and its associates, which include Russia.
Decreasing the global oil output can result in an imbalance between the supply and demand, which has the potential to worsen inflation.
The latest Job Openings and Labor Turnover Survey report (JOLTS) showed a dramatic slowdown in the U.S. labor market. The number of job openings in February decreased to 9.9 million from 10.6 million recorded on the last day of January, marking the first time this has happened in nearly two years. Note that employment is always a lagging indicator and often the final economic datapoint to collapse prior to the start of a recession.
The Fed has been focused on cooling down inflation by tackling the robust labor market, which had reached its highest point in 41 years during the summer of 2022. Despite the central bank’s nine interest rate hikes since March 2022, there appeared to be little effect on the employment situation. Before the February statistics, the number of job openings had surpassed the number of available workers by nearly a 2-to-1 ratio. However, the latest data indicates that the ratio has dropped to less than 1.7 to 1.
This provide conclusive evidence to indicate that the U.S. economy is in a state of contraction, the risk of a recession in the second half of the year is evident.
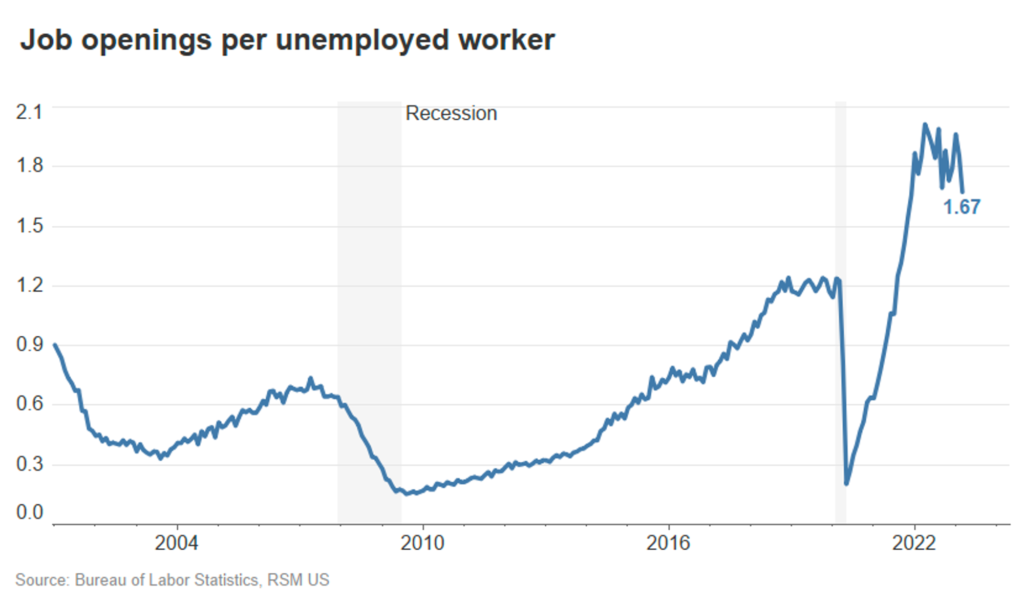
Although the Fed welcomed the downside surprise, there still exists a significant difference between the demand and supply of labor compared to the robust pre-pandemic labor market. Prior to the pandemic, there were only approximately 1.2 job vacancies for every unemployed worker in 2019.
If our prediction of an economic recession in the latter half of the year comes true, labor demand is likely to decrease significantly, resulting in more layoffs and a higher unemployment rate. However, until that time, labor demand is expected to surpass supply, leading to the creation of more jobs.
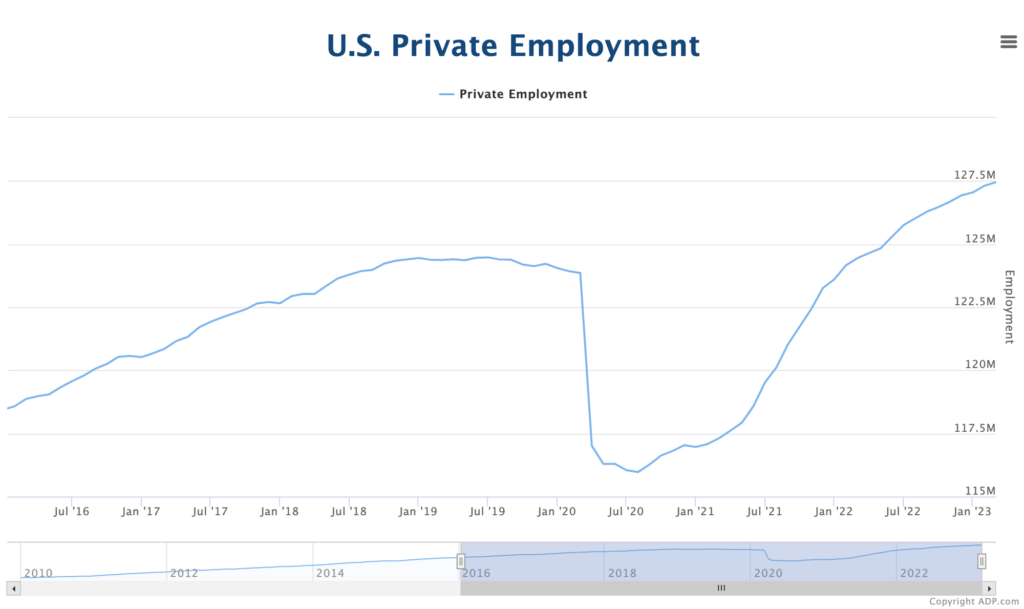
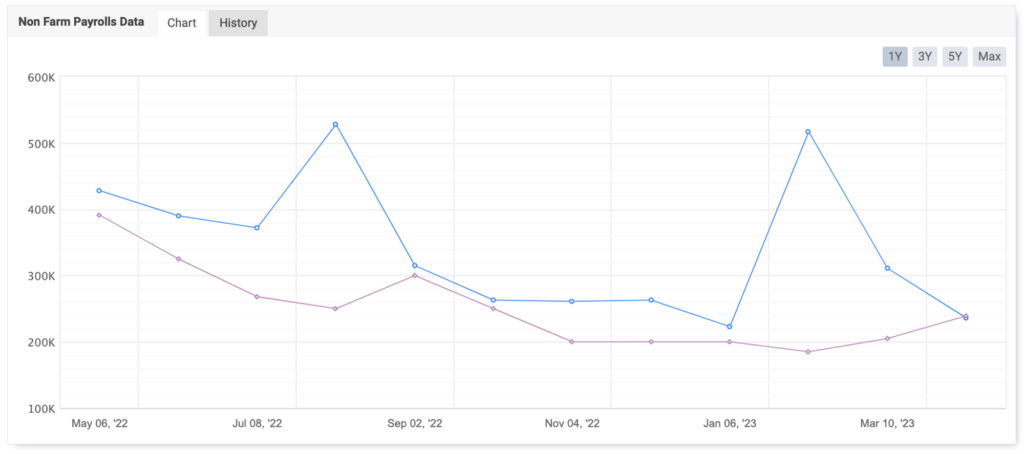
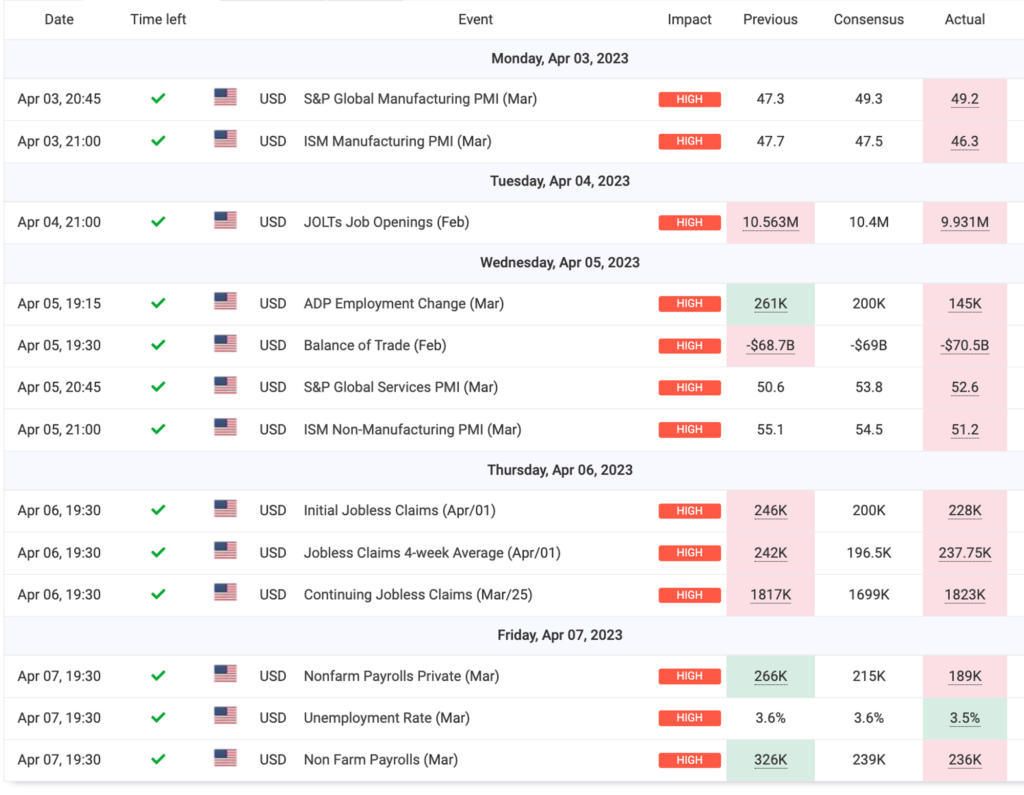
ADP reported on Wednesday that the rate of hiring in the private sector has slowed down in March, which could indicate a potential sharp economic slowdown or recession in the US. The payroll processing firm stated that there was only a rise of 145,000 in company payrolls for the month, which is lower than the Dow Jones estimate for 210,000 and a decline from the upwardly revised 261,000 in February. The average of monthly job hiring for the first quarter was just 175,000, which is lower than the fourth quarter’s 216,000 and significantly lower than the average of 397,000 in the first quarter of 2022. According to ADP, the March payroll data is one of several signals indicating that the economy is slowing down.
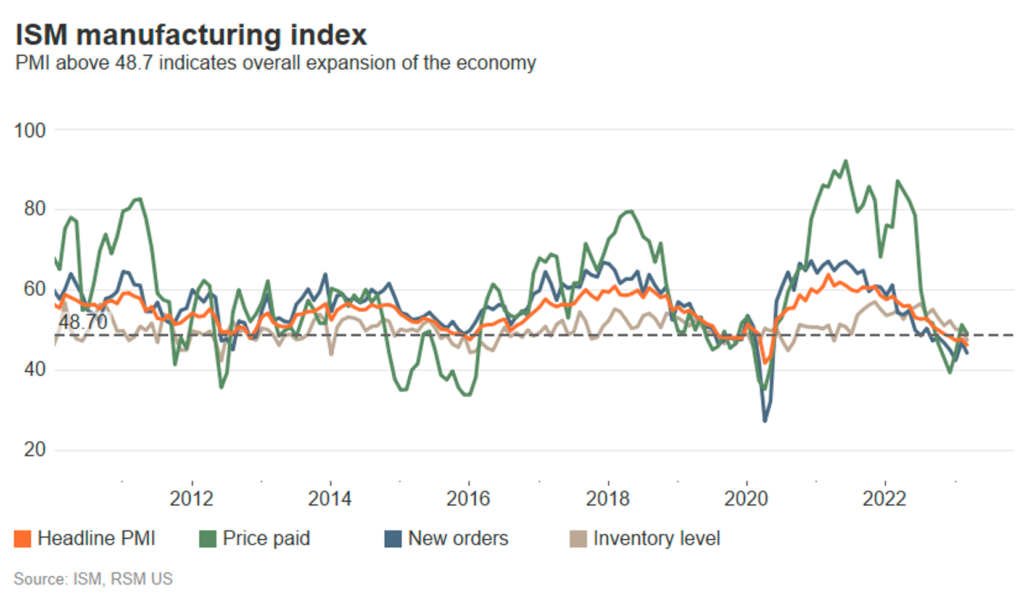
Also, new data released by the Institute for Supply Management on Monday indicates that the manufacturing sector experienced its fourth consecutive month of contraction in March. The decline in demand continued to worsen due to the impact of steep interest rate hikes. This suggests that the manufacturing sector may already be in a recession. The March ISM manufacturing index fell from 47.7 in February to 46.3, with an overall index below 48.7 indicating contraction. For subindices, the threshold is 50.
According to the Bureau of Labor Statistics, nonfarm payrolls rose by 236,000, consistent with forecasts, following a revised 326,000 increase in February. Furthermore, the unemployment rate decreased to 3.5%, and average hourly earnings increased by 4.2% from the previous year, falling short of projections and marking the slowest growth since June 2021.
As the economy continues to show signs of strain and the central bank evaluates the full effects of monetary tightening, this strengthen our take that the Fed has reached or is nearing its highest policy rate. The Fed has expressed its intention to stir towards a relatively gentle economic slowdown, which may result in a recession.
Crypto Analysis
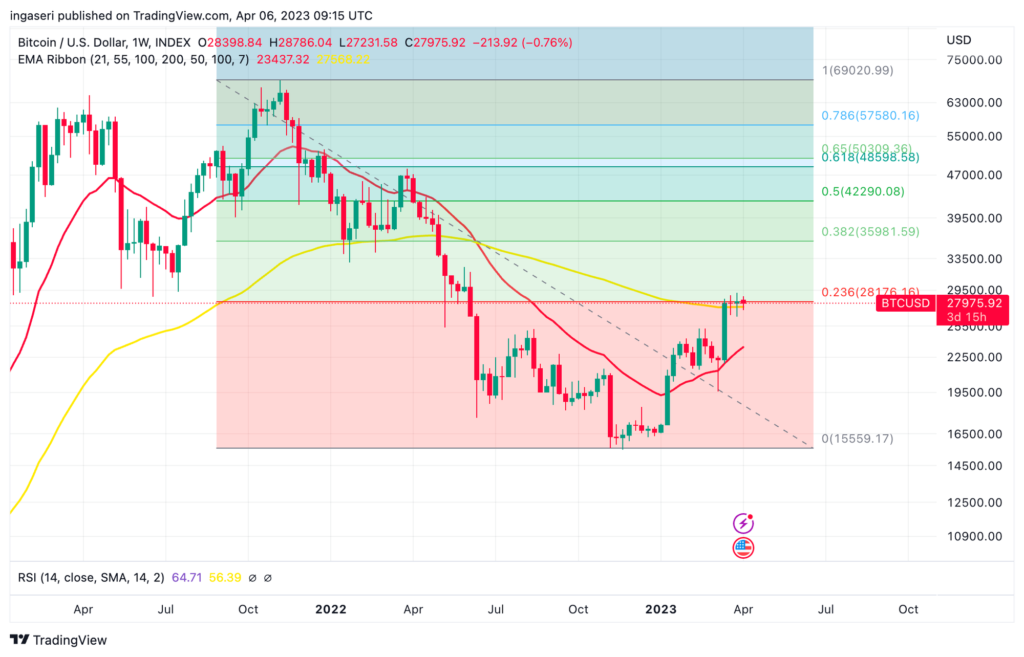
On 1st of April, BTC has created history by closing above a Macro Downtrend for only the third time ever. These downtrends are diagonal resistances that keep prices down for several months from the previous ATH to the Bear Market bottom. A Monthly Close beyond this downtrend has historically been followed by a mid- to long-term Macro Uptrend.
In 2019, BTC experienced three months of continuous growth after such a Monthly Close before hitting a Local Top at $13900 in June 2019. Interestingly, the downside wick of the March 2020 crash retested the same price point that BTC would have retested as support if it had immediately dipped after the breakout. In 2015, a short-term retest was required for BTC to flip the Macro Downtrend from old resistance to new support. In both cases, the breakouts were followed by long-term growth.
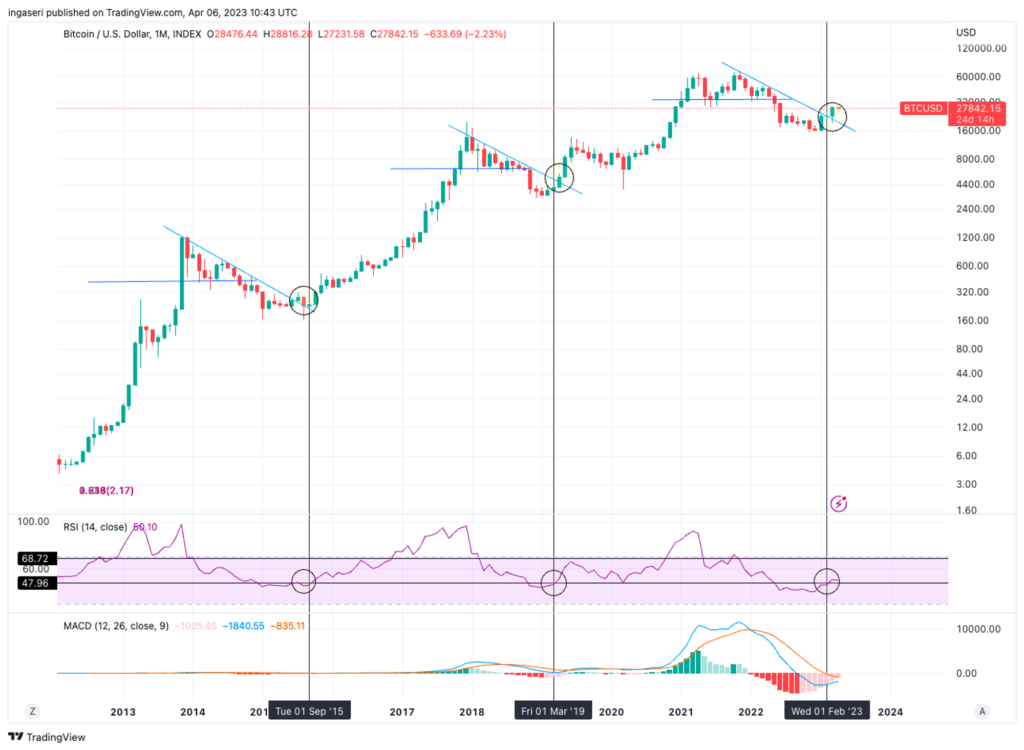
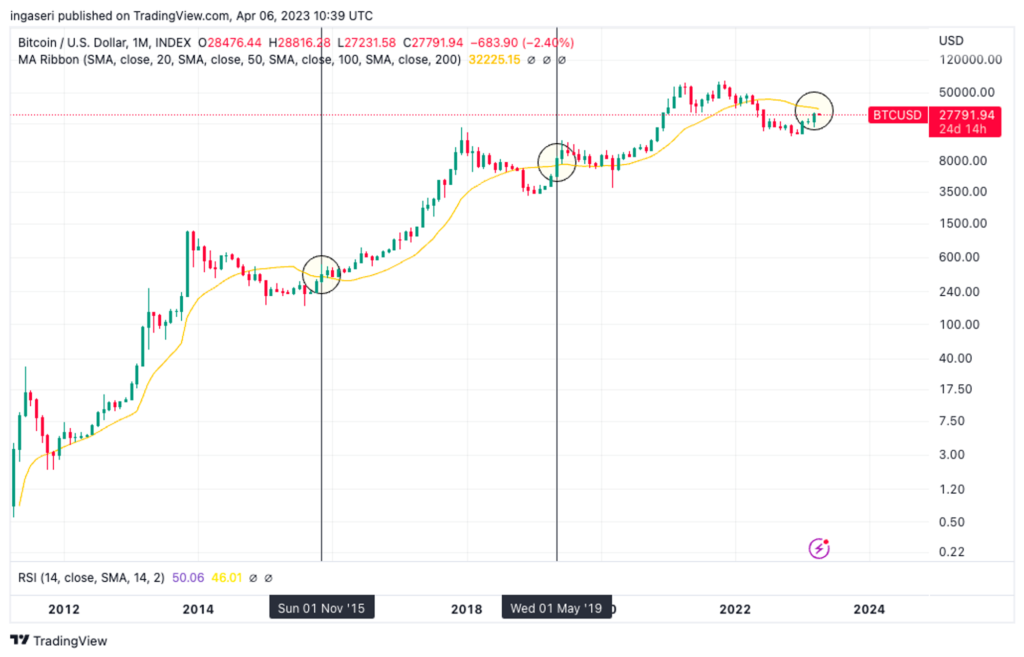
Although as shown above: BTC has recently broken its Macro Downtrend, but the continuation of the rally is yet to be seen, and the Local Top of the rally is still distant. Currently, BTC is 14% away from the 20-Month MA shown below, which is crucial because BTC has historically closed above it on a monthly basis, retested it as support, and then continued its trend. This pattern was observed in the 2015 and 2019 cycles, with the only difference being the extent of the trend continuation, that when BTC continued its uptrend in 2015, whereas it topped in June 2019 during its uptrend.
Zooming in to the weekly chart, we can see that BTC has hit resistance for the 4th consecutive weeks at the Fibonacci retracement line of 0.236 at 28,100 price point.
On-Chain Analysis
- 📊 Exchange: As the exchange reserve continues to fall, it indicates lower selling pressure. Net deposits on exchanges are high compared to the 7-day average. Higher deposits can be interpreted as higher selling pressure.
- 💻 Miners: Miners’ are selling holdings in a moderate range compared to its one-year average. Miner’s revenue is in a moderate range, compared to its one-year average.
- 🔗 On-Chain: More investors are selling at a profit. In the middle of a bull market, it can indicate a market top. Long term holders’ movement in the last 7days were lower than the average. They have a motive to hold their coins. Investors are in an anxiety phase where they are currently in a state of moderate unrealized profits.
- 🏦 Derivatives: Long position traders are dominant and are willing to pay to short traders. Selling sentiment is dominant in the derivatives market. More sell orders are filled by takers. As open interest decreases, it indicates investors are closing futures positions and possibility of trend reversals. In turn, this might trigger the possibility of long/short-squeeze caused by sudden price movement or vice versa.
- 🔀 Technicals: RSI indicates a neutral condition. It indicates a neutral condition where the current price is in a moderate location between the highest-lowest range of the last 2 weeks.
Altcoin News
- ⚠️ Dogecoin Drops After Elon Musk’s Twitter Stops Using Its Dog Logo. The price of Dogecoin (DOGE) fell by 7.3% to around 8.6 cents after Twitter stopped using the cryptocurrency’s mascot as its logo. The drop occurred after DOGE surged to as high as 10.5 cents on April 3 when Twitter unexpectedly changed its logo to feature Dogecoin’s Shiba Inu instead of its iconic blue bird.
- 🚨 SushiSwap hacked, Head Chef says ‘revoke all chains’. SushiSwap, a decentralized exchange, has suffered an exploit that resulted in the loss of over $3.3 million from one user, identified as 0xSifu on Twitter. The exploit was caused by a bug related to the “approve” function on the RouterProcessor2 contract. Both PeckShield and SushiSwap Head Chef Jared Grey advise users to revoke the contract on all chains to prevent further damage.
Other News from the Crypto World in the Last Week
- 📲 OpenSea launches OpenSea Pro. Last Tuesday, OpenSea launched OpenSea Pro, an NFT marketplace with advanced features targeting professional NFT traders who has grown rapidly after Blur since its launch. With OpenSea Pro, traders can enjoy advanced features as well as 0% fees, instant sales, inventory management and optimization of fuel costs.
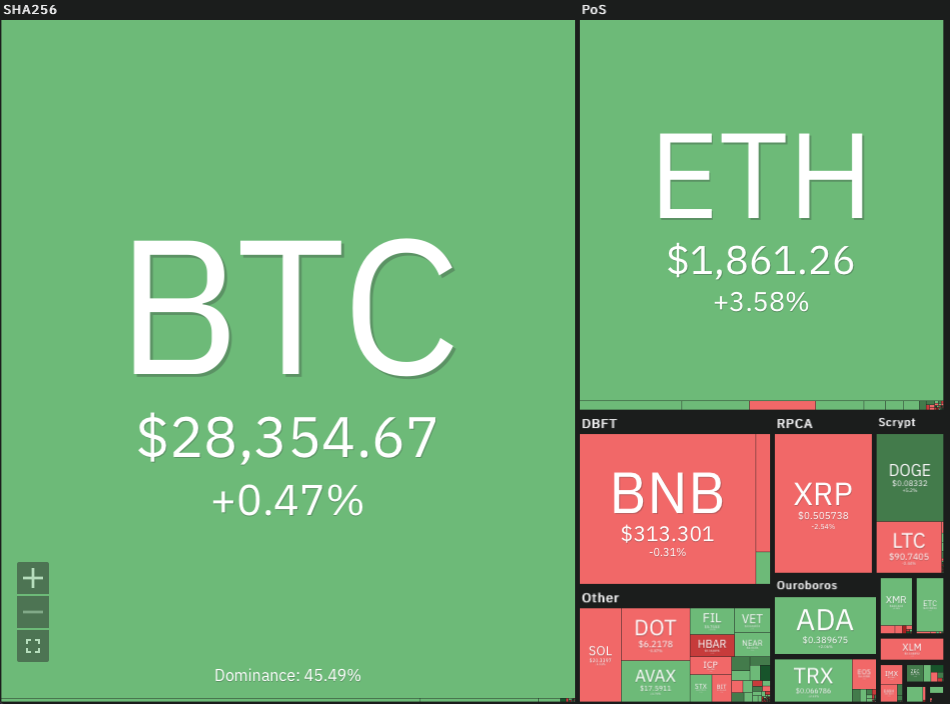
Cryptocurrencies Market Price Over the Past Week
Cryptocurrencies With the Best Performance
- Curve DAO (CRV) +11.7%
- Chilliz (CHZ) +10.8%
- Injective Protocol (INJ) +9,41%
- Dogecoin (DOGE) +5%
Cryptocurrencies With the Worst Performance
- Hedera (HBAR) -11%
- Aptos (APT) -9,3%
- Ziliqa (ZIL) -5.6%
- Quant (QNT) -4.5%
References
- Shariq Khan, Oil leaps 6% as OPEC+ shocks markets by cutting output target, Reuters, diakses pada 9 April 2023
- Adam James, SushiSwap hacked, Head Chef says ‘revoke all chains’, The Block, accessed on April 9, 2023
- Cam Thompson, OpenSea Launches OpenSea Pro, Courting Professional NFT Traders, CoinDesk, accessed on April 9, 2023
- Nick Baker, Dogecoin Drops After Elon Musk’s Twitter Stops Using Its Dog Logo, CoinDesk, accessed on April 9, 2023