
Over the past week, Bitcoin and Ethereum have continued on a downward trend, with BTC breaching the 21-month EMA support line, indicating further potential declines. This occurs despite the U.S. labor market exhibiting exceptional performance, generating over 10 million job openings, yet failing to alter the negative sentiment surrounding BTC. For a comprehensive report, refer to the market analysis on Pintu Academy.
The Pintu trading team has gathered critical information and analyzed the general economic situation and the crypto market’s movements over the past week. However, it should be noted that all information in this Market Analysis is intended for educational purposes, not as financial advice.
Market Analysis Summary
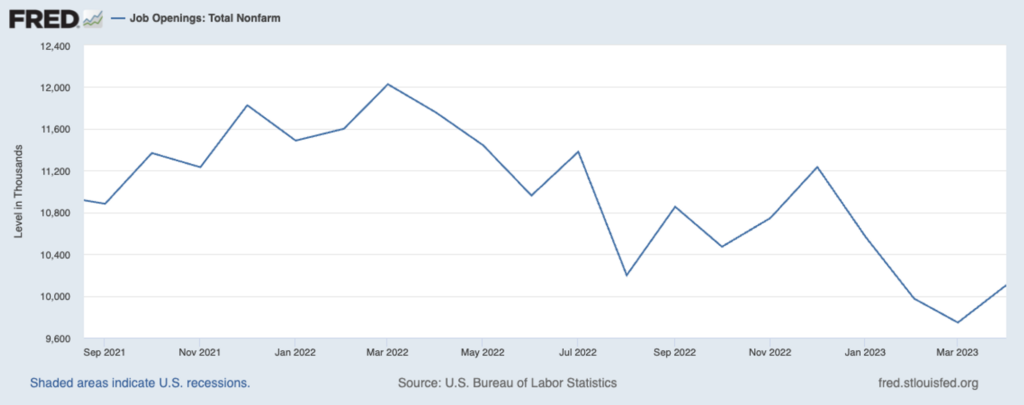
- 💪🏻 The U.S. labor market displayed significant growth in April, a development that could prompt the Federal Reserve to increase interest rates in June. With 10.1 million job vacancies, this signals an end to a three-month consecutive decline in job openings.
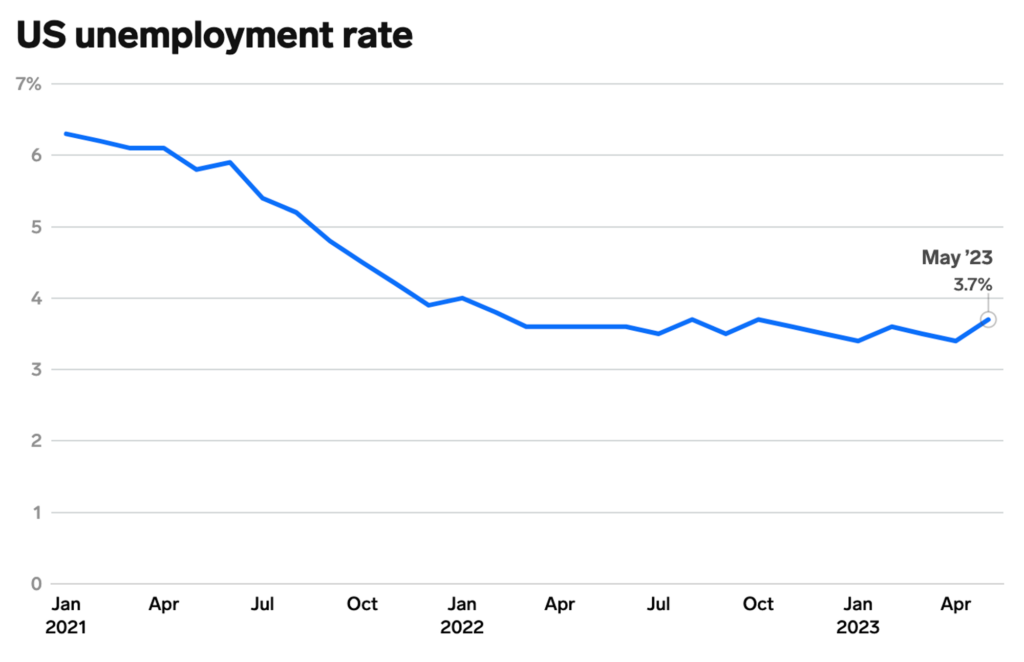
- ✅ Despite an increase in unemployment to 3.7% in May, this remains the lowest level since 1969. This suggests that the economy continues on a positive trajectory albeit with a minor uptick.
- 🏛️ Federal Reserve members, Philip Jefferson and Patrick Harker, hinted at the possibility of a delay in monetary tightening at the upcoming meeting. This has led to a shift in market sentiment.
- ⬇️ The S&P Global and ISM Manufacturing PMIs for May indicated a decrease, raising concerns about economic stability and potential recession. In the coming months, further declines in production and commodity prices are projected.
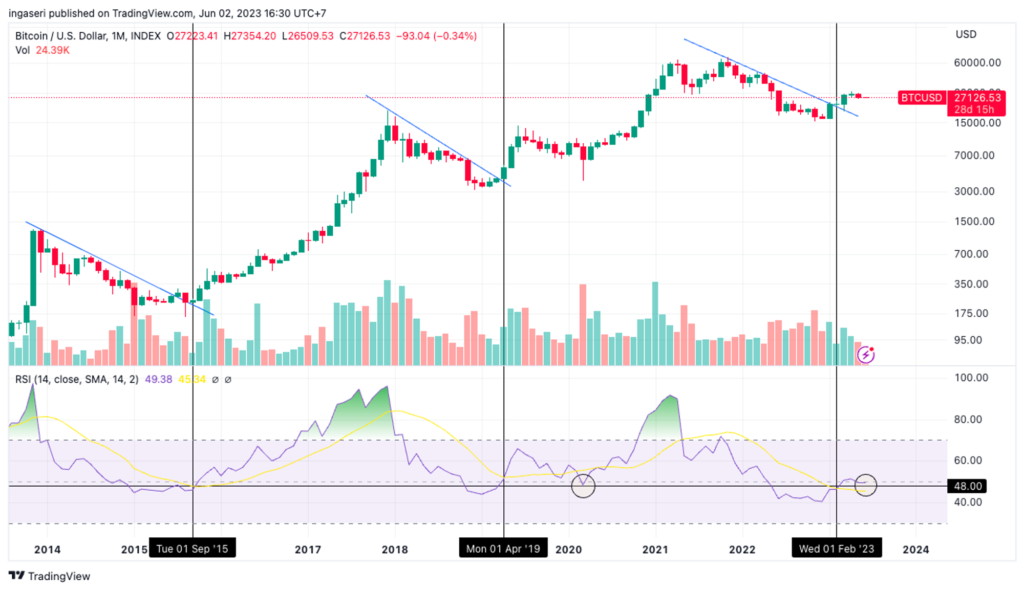
- ✍🏻 The monthly Bitcoin (BTC) candle broke below the 21-month EMA support line in May, whereas Ethereum (ETH) needs to be monitored at a price of $1830, with resistance at the psychological level of $2000.
Macroeconomic Analysis
The U.S. labor market is currently exhibiting positive sentiment as the unexpected growth in job openings data for April outpaced the previously revised data. This favorable labor market sentiment might prompt the Federal Reserve to raise interest rates in June.
According to the Job Openings and Labor Turnover Survey (JOLTS) report released by the Department of Labor on Wednesday, there was a significant reduction in dismissals last month. An examination of the data for April reveals 1.8 million job vacancies, up from 1.7 million in March. This increase surpasses the typical range of 1.0 to 1.2 million job openings that are associated with a balanced labor market that avoids excessive inflation.
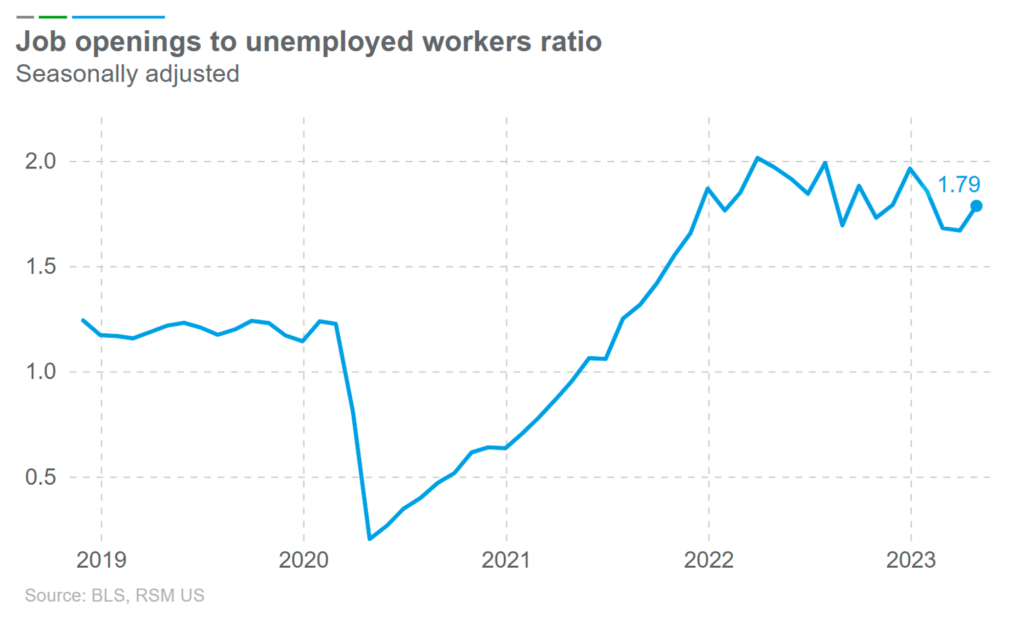
The job demand indicator in April was extremely robust, in line with the significant rise in job vacancies by 358,000, reaching a total of 10.1 million vacancies. Even the revised data for March showed that there were 9.75 million job openings, contrasting with the previously reported figure of 9.59 million. Subsequently, the data for April marked the end of three consecutive monthly decreases in job vacancies. Going forward, job vacancies are predicted to be around 9.375 million, highlighting a considerable deviation from the actual figure.
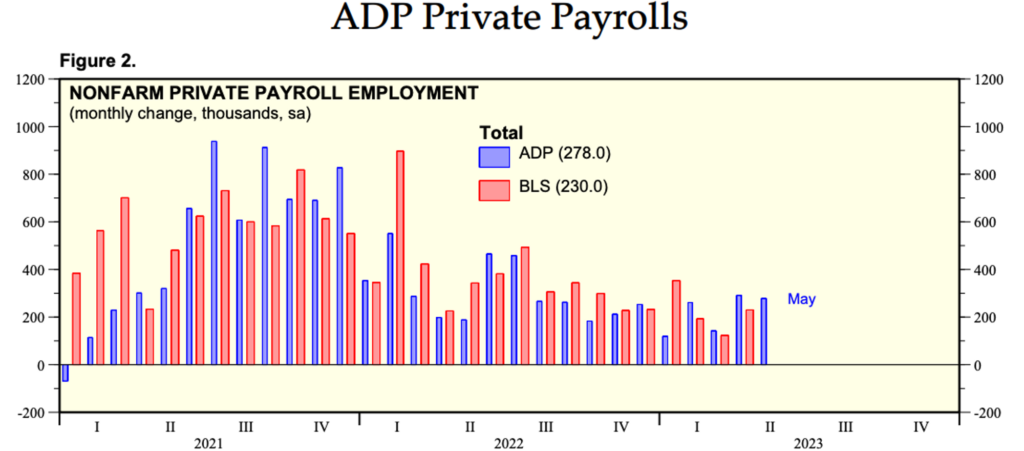
According to a report from Automatic Data Processing (ADP), private payrolls in the United States increased by 278,000 jobs in May, slightly below the revised figure of 291,000 jobs in April, but above the forecast of 170,000 jobs. According to ADP’s chief economist, there was a significant decline in wage growth for transitioning workers for the second consecutive month. In addition, a significant slowdown in wage growth, which could trigger inflation, may be easing alongside the continued strong hiring trend.
Small and medium-sized businesses continued to be the main drivers of job openings, contributing 235,000 and 140,000 jobs, respectively. Meanwhile, large companies reportedly added 106,000 jobs. The service sector with the most job openings was led by leisure/hospitality with 208,000, followed by utilities with 168,000, goods-producing industries with 110,000, natural resources/mining with 94,000, and construction with 64,000. Finally, trade/transportation added 32,000 jobs.
However, there were two sectors that experienced a decline, namely the financial sector, which shed as many as 35,000 workers, and the manufacturing sector, which reported a decline of 48,000 jobs.
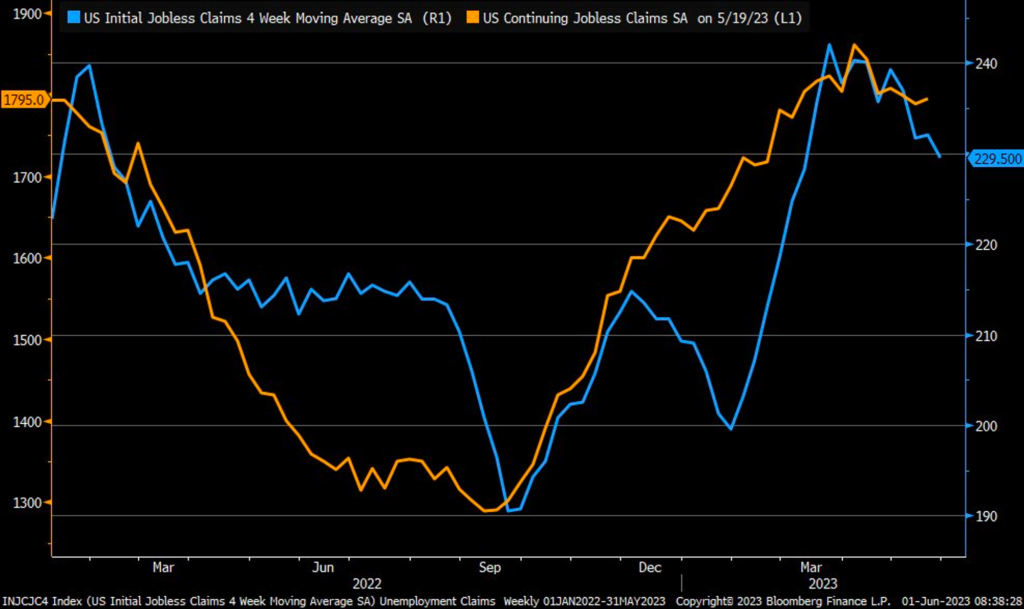
The decline in the number of job openings and layoffs in several sectors is consistent with Thursday’s report from the Labor Department, which showed that initial claims for state unemployment benefits rose by 2,000 to a seasonally adjusted total of 232,000 for the week ending May 27. Economists had expected 235,000 claims for the same week. Economists also speculate that jobless claims have likely peaked, as they remained relatively stable throughout May without significant fluctuations.
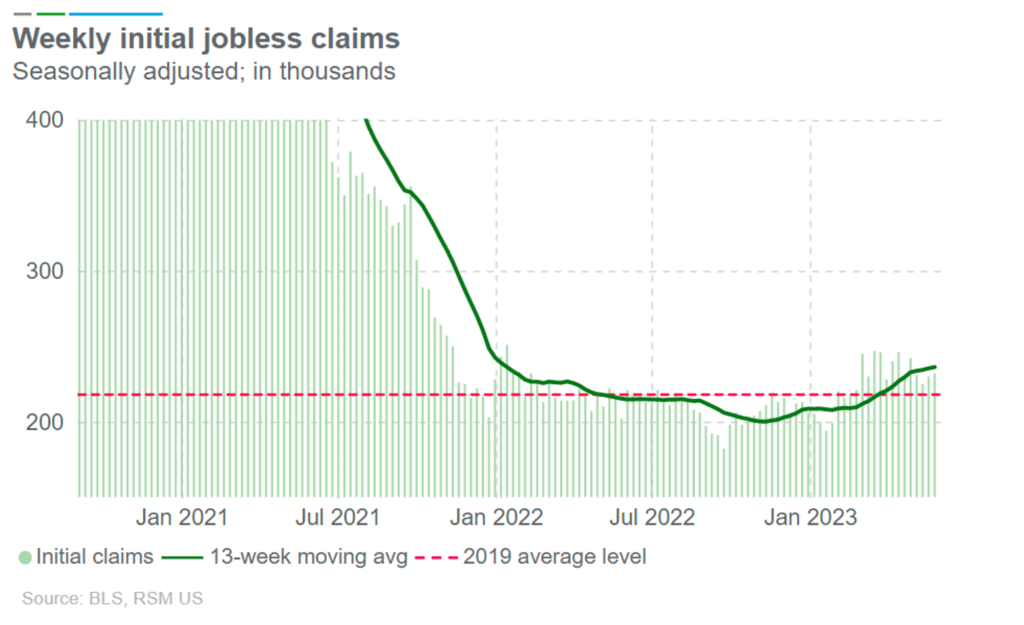
The four-week moving average, which serves to temper week-to-week fluctuations, declined from 232,000 to 229,500.
As for the continued unemployment benefit claims for the week ending on May 20, a slight increase was observed from the lower revised figure of 1,789,000 to 1,795,000. However, this number remains lower than the forecasted 1,800,000. Notably, California reported a significant surge in unemployment claims, with an increase of 44,402, while Texas recorded an increase of 19,344.
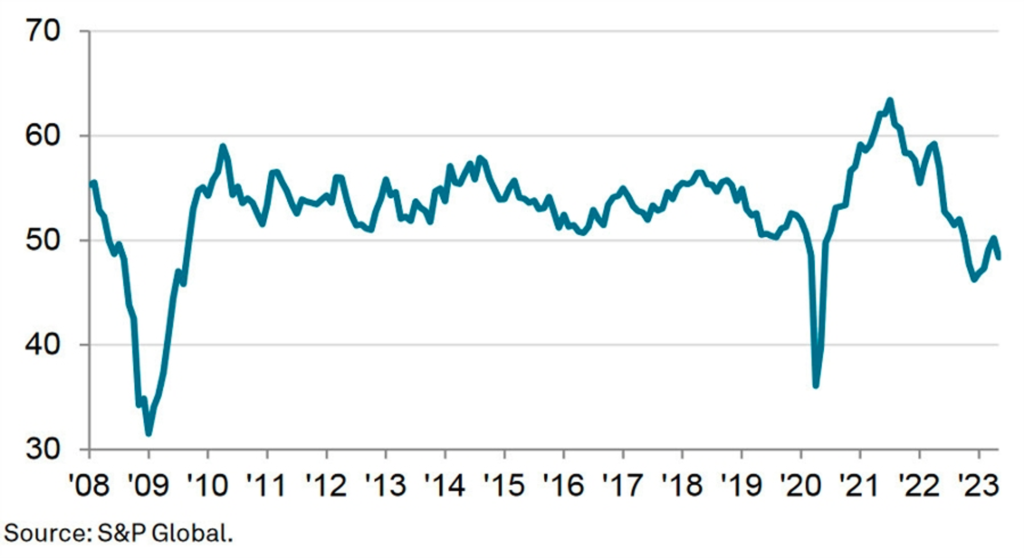
The S&P Global Manufacturing PMI Index fell to 48.4 in May from 50.2 the previous month, indicating a deeper contraction in business conditions. This decline adds to concerns about overall economic stability and the potential threat of recession. In the coming months, output and prices are expected to remain under pressure from a number of factors, including the impact of rising interest rates, higher living costs, economic uncertainty and a shift in consumer spending from goods to services in the post-pandemic period.
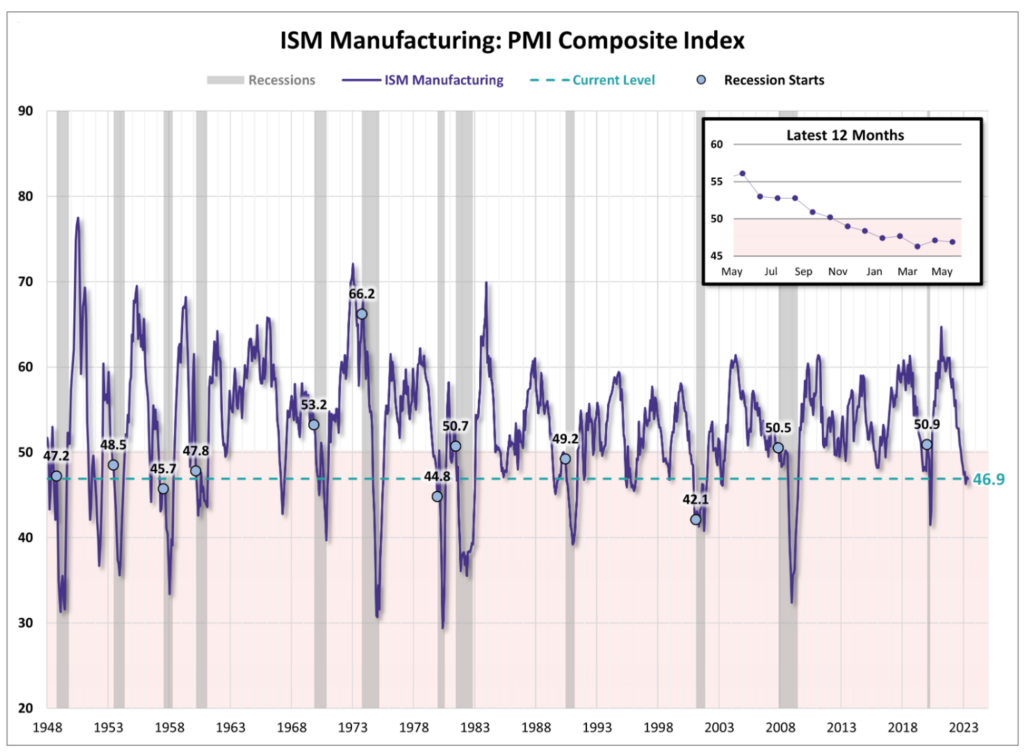
In line with the S&P Global Manufacturing PMI, the ISM Manufacturing PMI fell to 46.9% in May, a slight decrease of 0.2% from the previous month’s reading of 47.1%. This decline marks the seventh consecutive month of contraction in the manufacturing sector after 29 months of expansion.
In contrast to the decline in manufacturing, the public and private sectors added 339,000 jobs, beating the Dow Jones forecast of 190,000. This continues the trend of 29 consecutive months of job growth and represents the largest increase in the past four months. Moreover, revisions to the April and March job gains indicate even stronger growth than previously reported.
Looking at the period from March to May, the United States has added an average of 283,000 jobs per month. The pace of job growth is nearly three times the target set by the Federal Reserve in its efforts to curb high inflation.
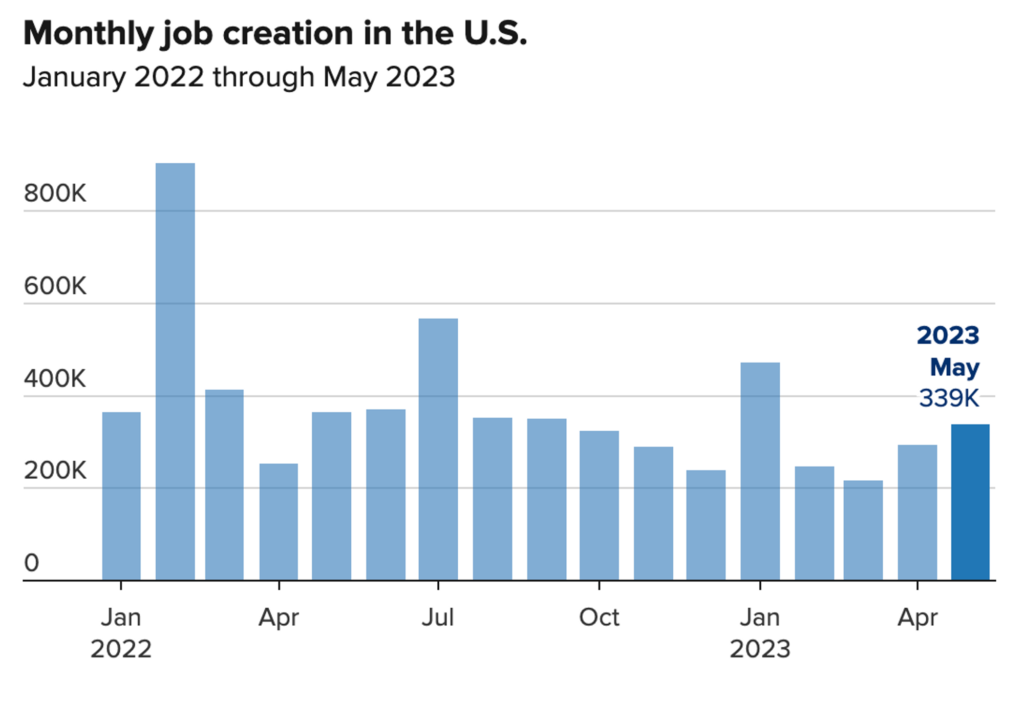
Despite the significant increase in job growth, the unemployment rate actually rose to 3.7% in May, higher than the expected rate of 3.5%, even though the labor force participation rate was unchanged. While this increase marks the highest unemployment rate since October 2022, it is still close to the lowest level since 1969.
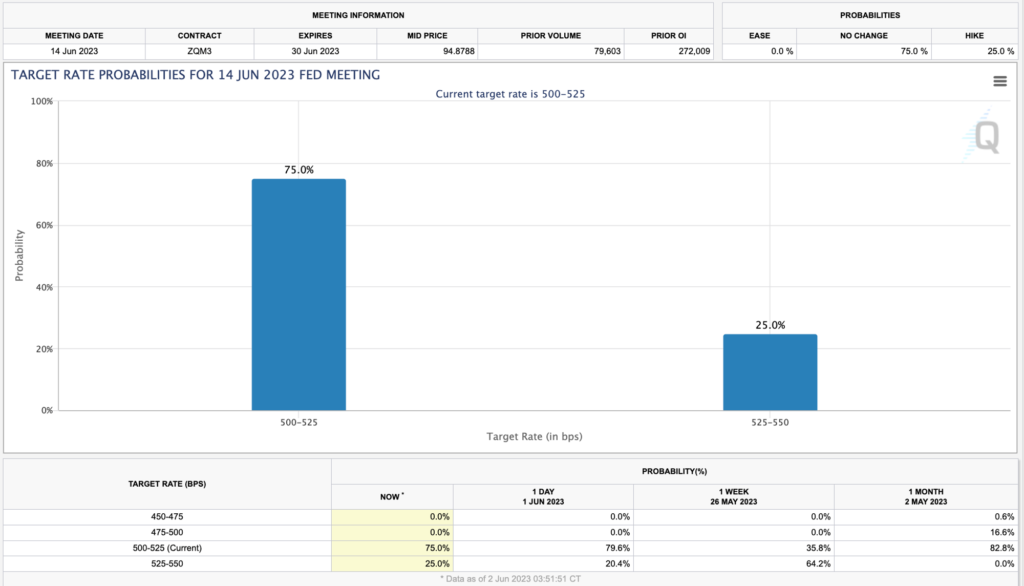
At the beginning of June, initial market projections indicated that the Federal Reserve would raise interest rates in June. However, comments from Federal Reserve members, particularly Philip Jefferson and Patrick Harker, who took a dovish stance and signaled the possibility of a delay in tightening at upcoming meetings, changed sentiment. Based on CME data, traders are pricing in as much as a 25% probability of a 0.25% rate hike by the Fed in June. As a result, risk assets rallied sharply on Thursday, while the dollar fell.
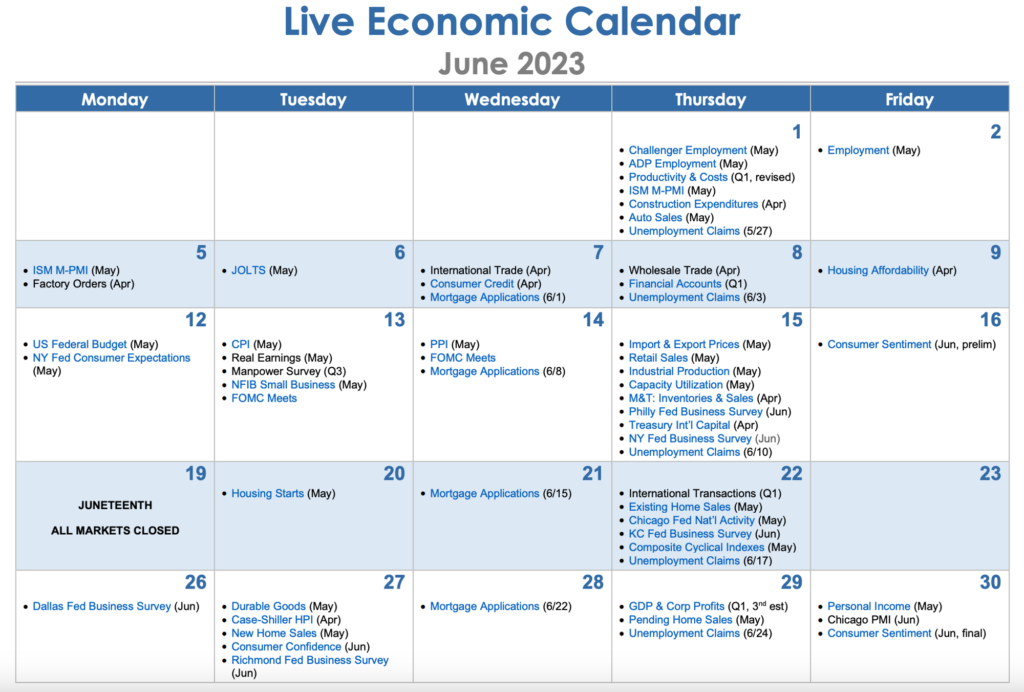
Here is the economic calendar for the month of June:
BTC & ETH Price Analysis
As the May monthly candle closed, the BTC monthly candle broke below the support line of the 21-month exponential moving average (EMA). As a result, there is a possibility of further declines ahead of the Federal Open Market Committee (FOMC) rate hike in mid-June. The current price of the BTC does not appear to be pricing in the possibility of a June rate hike by the Fed.
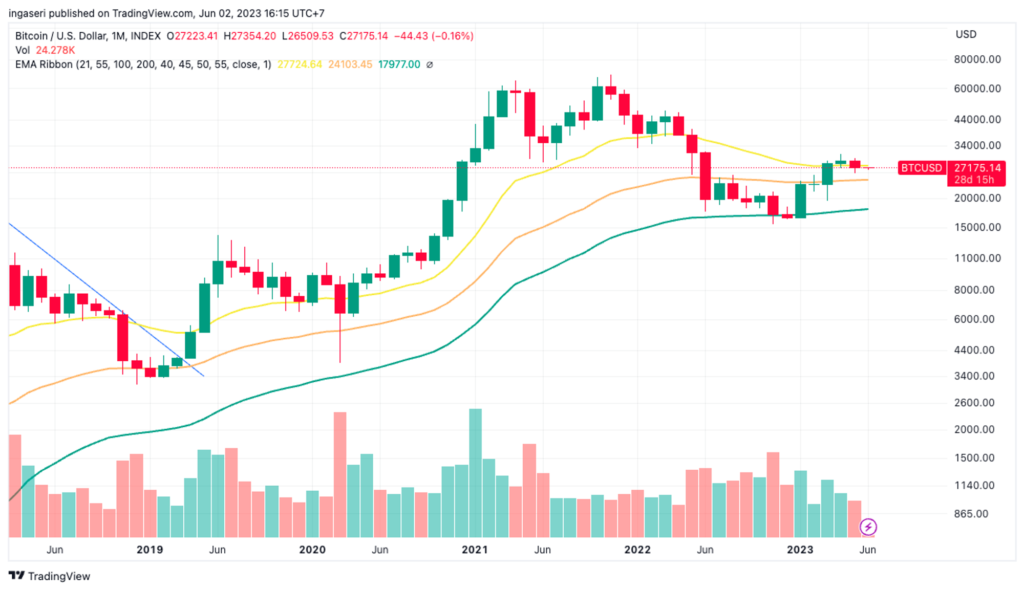
This cycle could potentially repeat the pattern seen in the previous cycle, where BTC successfully broke below the 21-month EMA, only to retreat toward the Relative Strength Index (RSI) support level at 48. If history repeats itself, the RSI level is expected to touch the support line before reversing to the upside.
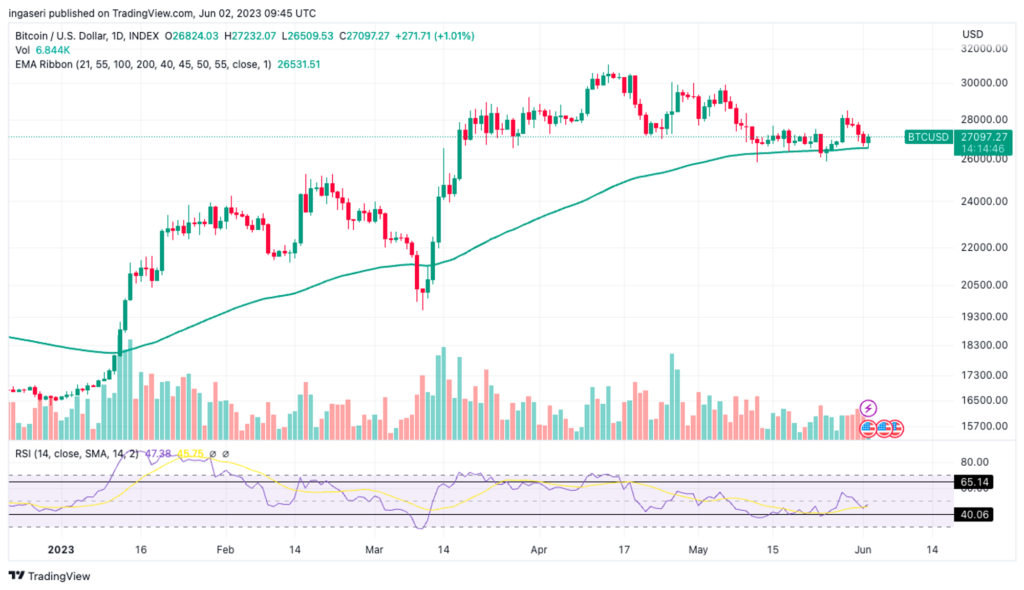
Analyzing the daily chart, it appears that BTC is still in an upward trend. BTC is currently approaching the 100-day exponential moving average (EMA), and if the bulls can hold the support line, the positive trend is expected to continue.
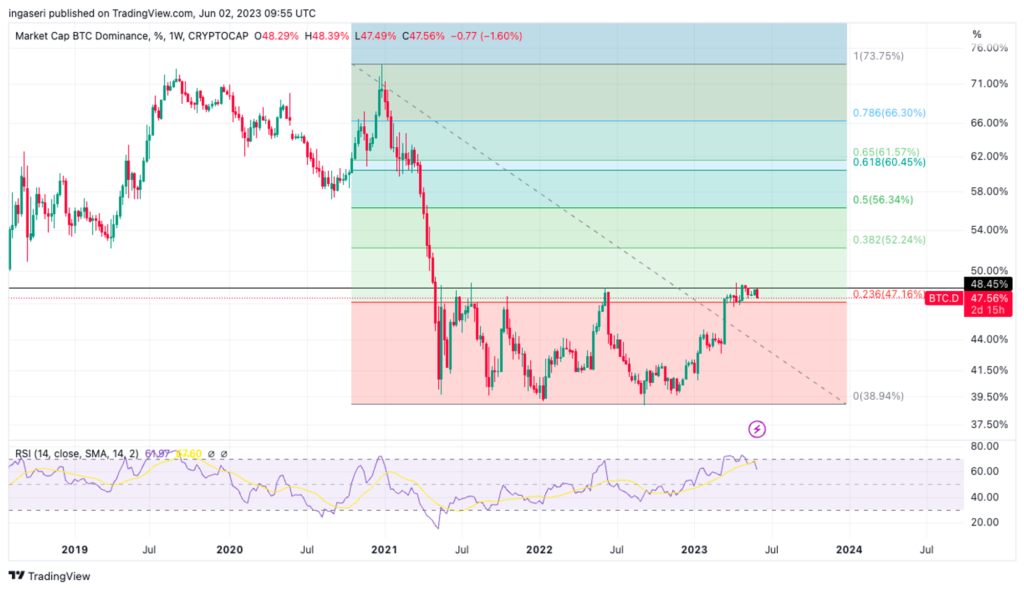
Meanwhile, Bitcoin Dominance continues to fall by 1.6% week-over-week after hitting a resistance line. This decline was expected as it reached its highest level since peaking earlier this month. However, BTC Dominance is still within the 47% support line. If it breaks below this support, it could indicate a shift to the negative side.
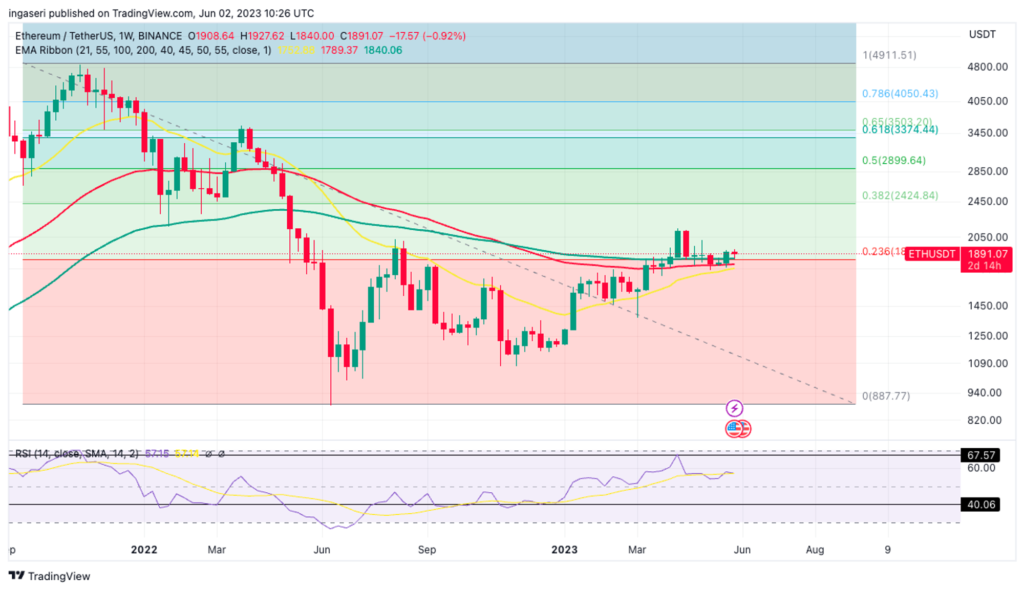
Currently, ETH is retracing to the support of the 100-week EMA and the 0.236 Fibonacci level, one week after breaking below this support. Support for ETH is at $1830 and resistance is at the psychological level of $2000.
On-Chain Analysis
- 📊 Exchange: As the exchange reserve continues to rise, it indicates higher selling pressure. Net deposits on exchanges are low compared to the 7-day average. Lower deposits can be interpreted as lower selling pressure.
- 💻 Miners: Miners’ are selling more holdings compared to its one-year average. Miner’s revenue is in a moderate range, compared to its one-year average.
- 🔗 On-chain: More investors are selling at a profit. In the middle of a bull market, it can indicate a market top. Long term holders’ movement in the last 7days were lower than the average. They have a motive to hold their coins. Investors are in an anxiety phase where they are currently in a state of moderate unrealized profits.
- 🏦 Derivatives: Long position traders are dominant and are willing to pay to short traders. Buying sentiment is dominant in the derivatives market. More buy orders are filled by takers. As open interest decreases, it indicates investors are closing futures positions and possibility of trend reversals. In turn, this might trigger the possibility of long/short-squeeze caused by sudden price movement or vice versa.
- 🔀 Technicals: RSI indicates a neutral condition. Stochastic indicates a neutral condition where the current price is in a moderate location between the highest-lowest range of the last 2 weeks.
News About Altcoins
- Save the date! EDCON 2024, the Ethereum developer conference, will take place in Japan. According to @EDCON2024, the upcoming community Ethereum development conference “EDCON 2024” will be held in Japan. Previously, EDCON 2023 was held in Podgorica, Montenegro from May 19-23, 2023. In addition to EDCON, Ethereum organizes several other community events throughout the year, including EthCC, ETHDenver, Devcon and ETHglobal.
- zkSync era: Growing active addresses and transactions, approaching Arbitrum, and surpassing optimism. Based on data from Artemis and the Dune Dashboard by @sankin_eth on May 30th, the zkSync era is approaching Arbitrum in terms of active addresses and transaction volume, but still lags behind in terms of stored funds. Currently, Arbitrum holds about 1.07 million ETH and 1.77 billion USD in stablecoins. Meanwhile, Optimism has 290,000 ETH and 470 million USD in stablecoins. In contrast, the zkSync era has only about 120,000 ETH and 129 million USD in stablecoins.
News from the Crypto World in the Past Week
- Focus of the Beijing White Paper: Focus on Artificial Intelligence and Metaverse. Following the announcement of the upcoming release of the Beijing White paper, it is now available to access and study to understand the project’s crypto focus. The white paper highlights key technologies including blockchain, non-fungible tokens (NFTs), privacy-enhancing technologies, distributed autonomous organizations, social computing networks, on-chain data analytics, content security, and more. The Beijing Whitepaper distinguishes between Web3 and Internet 3.0, with a particular focus on artificial intelligence and the metaverse.
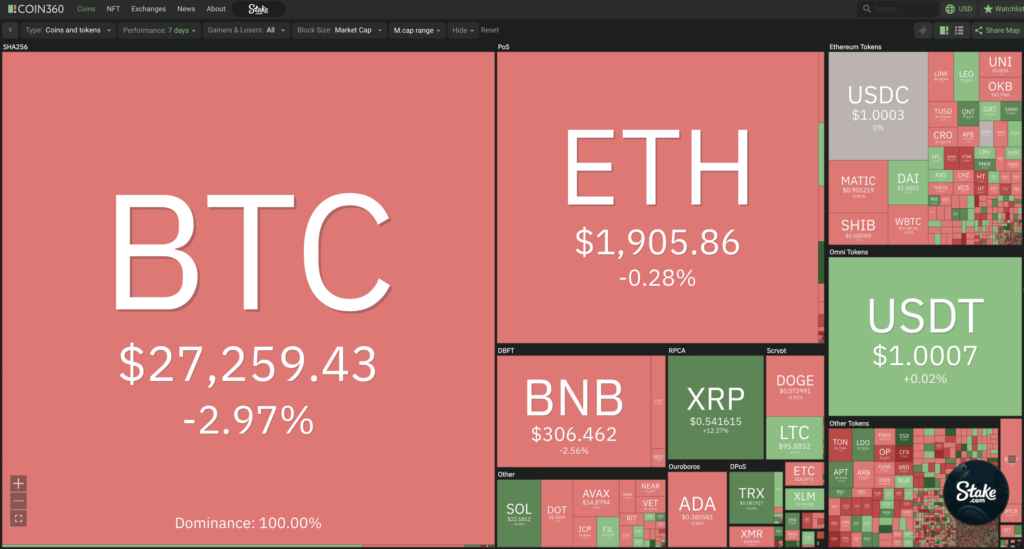
Cryptocurrencies Market Price Over the Past Week
Cryptocurrencies With the Best Performance
- ApeCoin (APE) +5.59%
- Decentraland (MANA) +5.02%
- The Sandbox (SAND) +4.39%
- Solana (SOL) +3.31%
Cryptocurrencies With the Worst Performance
- Filecoin (FIL) -4.03%
- WOO Network (WOO) -3.69%
- The Graph (GRT) -2.47%
- Arbitrum (ARB) -1.87%
References
- EDCON2024, こんにちは、日本への#EDCON2024参上, Twitter, accessed on 5 June 2023.
- Wu Blockchain, Full Text of Beijing Internet 3.0 White Paper: Distinguishing from Web3, with Emphasis on Artificial Intelligence and Metaverse, Wublock.substack, accessed on 5 June 2023.
- Wu Blockchain, zkSync Era Sees Active Addresses and Transaction Count Approaching Arbitrum, Surpassing Optimism, Wublock.substack, accessed on 5 June 2023.