The harami candlestick is a crucial indicator that signals a trend reversal, and it is applicable to traders in both uptrends and downtrends. In essence, the harami candlestick serves as a signal for a potential shift in market direction. If you’re curious about what a harami candlestick is and why it serves as a trend reversal signal, read on in the following article.
Article Summary
- ⚖️ Harami candlestick is a technical indicator pattern that signals a reversal, a change in the price trend in the market. There are two types of harami candlestick patterns: bullish harami and bearish harami.
- 📊 Harami candlestick can be identified when there is a large candlestick at the end of an uptrend or downtrend that completely engulfs the small candlestick after it.
- 🔍 Harami candlesticks in the crypto market differ slightly from regular patterns. This is because the 24×7 trading time in crypto assets makes the gap between harami candlesticks closer and tighter.
- ⚠️ There is a possibility of the harami candlestick giving false signals. Using other technical indicators and support & resistance points can provide more reliable harami candlestick signals.
What is a Harami Candlestick?
Harami candlestick is a technical indicator pattern that signals a reversal, a change in the price trend in the market. Thus, harami candlestick is widely used by traders when they want to buy or sell crypto assets.
The harami candlestick consists of two candlesticks. It formed when the second candlestick’s body was entirely swallowed by the previous candlestick’s body. This is why this candlestick pattern is called harami (Japanese for pregnant) because it looks like a woman with a pregnant body. Harami candlesticks can occur in both uptrend and downtrend.
The most important thing to identify a harami candlestick pattern is that the body of the second candlestick should be much smaller and entirely engulfed by the previous candlestick's body
However, you will want to wait for the market to confirm the reversal. The best way to do this is to wait for the next candlestick to close. If it turns out that the candlestick is also bullish, it ensures an uptrend reversal. Conversely, if the next candlestick is bearish, it confirms a downtrend reversal. Therefore, there are two kinds of harami candlestick patterns, namely bullish harami pattern and bearish harami pattern.
Bullish Harami Candlestick
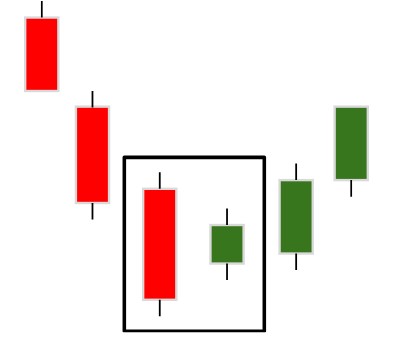
As seen in the image above, a bullish harami is a candlestick pattern that shows the price reversing into an uptrend. However, to be called a bullish harami, the asset price must be in a downtrend first.
Bullish harami occurs when a bullish candlestick (green) is smaller and completely engulfed by the previous large bearish candlestick (red). The small green candlestick indicates the selling pressure is decreasing, and the buyers are starting to take over. Meanwhile, a second bullish candlestick (green) confirms a reversal.
Bearish Harami Candlestick
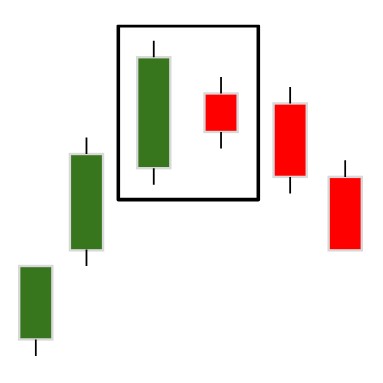
Meanwhile, bearish harami is the opposite of bullish harami. It is a candlestick pattern that gives a sign that the price is about to decline after being in an uptrend. The asset price must first be in an uptrend phase for the signal to be more reliable.
Similarly, bearish harami must start with a bullish (green) candlestick that completely engulfs the next bearish (red) candlestick. A large green candlestick means the buyer is dominating, so the price is still going up. Meanwhile, a small red candlestick signals that buying is declining and the sellers are starting to dominate. Then, the presence of the next bearish (red) candlestick will confirm the reversal.
Crypto Trading Using Harami Candlestick
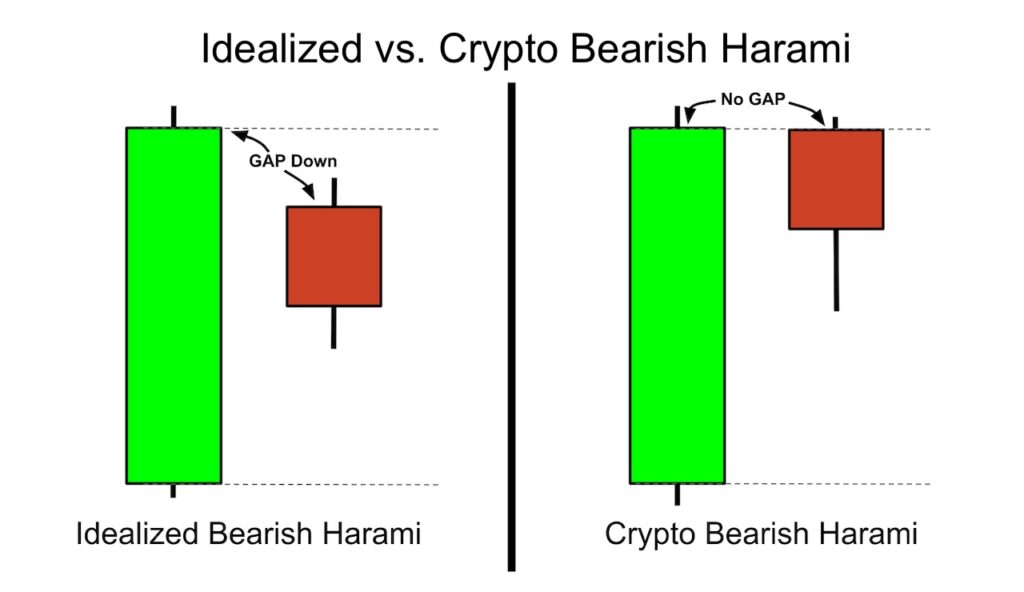
Unfortunately, there are differences in the harami candlestick pattern in the crypto market. This is because the characteristics of the crypto market are different from the stock and forex markets. They have a definite trading schedule that makes each candlestick have the same gap.
While in the crypto market, the gap of each candlestick is much closer because the trading runs 24×7 non-stop. This makes the shape of the second candlestick in the crypto harami a little different. It is no longer shaped like a pregnant woman. But the actual concept is still the same; the second candlestick must move opposite and be swallowed entirely by the previous candlestick.
Trading Using Bullish Harami Candlestick
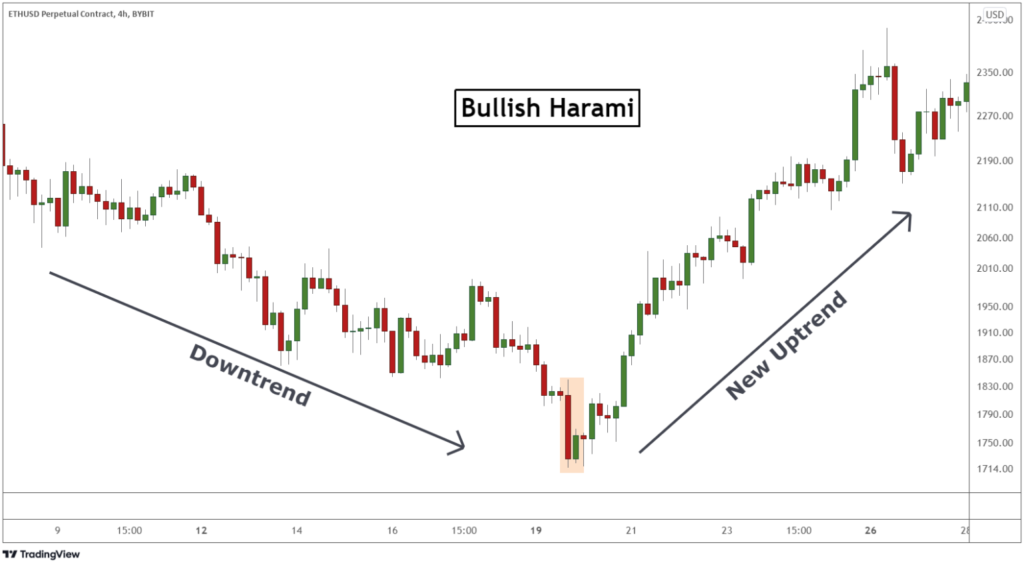
As a signal of reversal, a bullish harami will be considered more reliable when found in an oversold market. As seen in the ETH chart above, the bullish harami marks the end of the downtrend and the beginning of the uptrend. After a series of lower highs and lower lows, a large bearish candle appears at the beginning of the bullish harami pattern. It signaled the end of the downtrend phase, and the price soon entered the capitulation phase.
A capitulation phase is when traders sell their assets because they believe the price will continue to fall (bearish). Although considered a negative indicator, some investors believe this phase is an opportunity to buy because the prices are cheap.
After the large bearish candlestick, a swallowed smaller bullish candlestick appears. At this point, a bullish harami candlestick has formed. However, the next candlestick must be bullish as well to confirm that a trend reversal will happen. After the confirmed bullish harami appeared, the price of ETH turned higher. Keep in mind that not all trend reversals will end up in a rally. Some traders often use bullish harami as an entry point for accumulation.
Trading Using Bearish Harami Candlestick
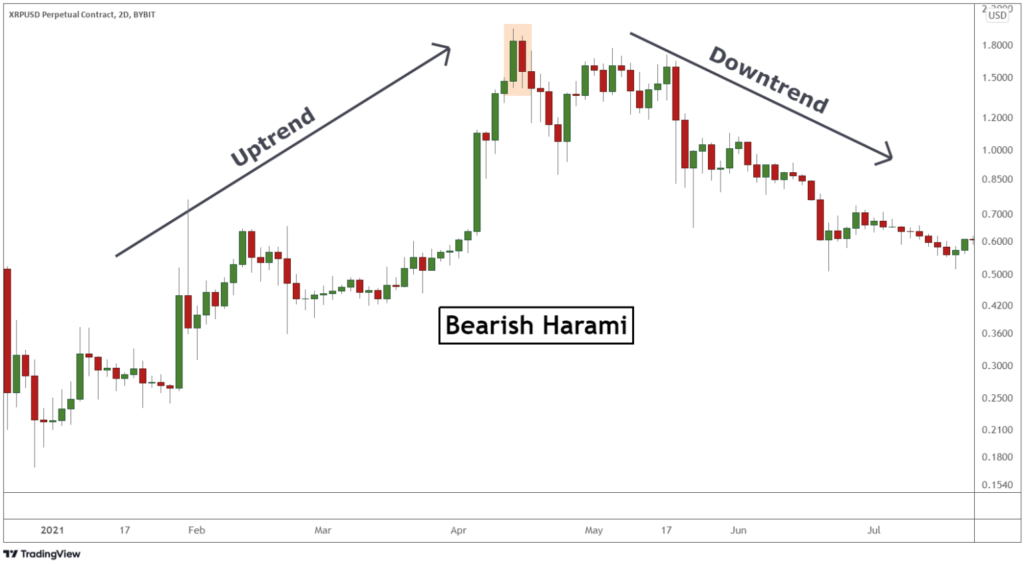
In contrast, a bearish harami is a sign that prices are about to start a new bearish trend. Inevitably, it can only be found at the end of an uptrend. For example, see the XRP price chart above. At the end of the uptrend, a large green candlestick appears. Then, it is followed by a red candlestick whose body is completely swallowed.
This shows a weak market condition that cannot push prices back up. After the appearance of the bearish harami, a red candlestick appeared. It confirmed the downtrend signal. As can be seen in the chart, XRP started a downtrend. The confirming candlestick can be used as an exit or entry point for traders who want to go short.
Trading Tips Using Harami Candlestick
The following are some tips that you can apply when trading using harami candlesticks.
- Use multiple time frames. Analyzing the harami pattern in various time frames can provide a more accurate market trend assessment. For example, if the harami candlestick pattern appears on both the daily chart and the 4-hour time frame, it can provide a stronger reversal signal.
- Combine with other technical indicators. Using other technical indicators can strengthen the signal and confirm the reversal trend. Generally, momentum and trend direction indicators such as RSI, MACD, and bollinger bands are often used.
- Use support and resistance. Changes in price trends and momentum are closely related to support and resistance points. If a harami pattern occurs near support and resistance areas, it strengthens the reversal signal.
- Apply risk management. Considering that harami candlesticks have the potential to give false signals, you should set stop-loss and take-profit orders as a form of risk mitigation. The stop-loss point can be below the lowest point of the small candlestick. Then, the take-profit order point can be adjusted according to your risk-reward ratio and potential target price.
Conclusion
As a technical indicator, the harami candlestick can help traders make better decisions. With harami candlestick, traders can determine entry and exit points for long and short positions. However, it should be noted that the harami candlestick may give false signals.
Therefore, it’s best to use other technical indicators, support and resistance levels, and market sentiment to ensure the signals are more reliable. Remember always to apply risk management to avoid unwanted losses.
Buy Crypto Assets in Pintu
Interested in investing in crypto assets? Take it easy, you can buy various crypto assets such as BTC, ETH, SOL, and others safely and easily. Furthermore, Pintu has subjected all its crypto assets to a thorough evaluation process, emphasizing the importance of prudence.
Pintu is also compatible with popular wallets such as Metamask to facilitate your transactions. Download Pintu app on Play Store and App Store! Your security is guaranteed because Pintu is regulated and supervised by Bappebti and Kominfo.
In addition to executing transactions, in the Pintu Apps, you can also learn more about crypto through various Pintu Academy articles updated weekly! All Pintu Academy articles are made for knowledge and educational purposes, not as financial advice.
Reference
James Chen, Bullish Harami: Definition in Trading and Other Patterns, Investopedia, accessed on 8 Mei 2023.
James Chen, Bearish Harami: Definition and Trading Strategies, Investopedia, accessed on 8 Mei 2023.
Warren Venketas, Harami Candlestick Patterns: A Trader’s Guide, DailyFx, accessed on 8 Mei 2023.
Richard Snow, A Guide to Multiple Time Frame Analysis, DailyFx, accessed on 9 Mei 2023