Are you struggling to determine the support and resistance levels of a crypto asset? Do you wish to understand the visual representation of technical indicators? Or curious about what the price trend of a crypto asset will be like in the future? Look no further than TradingView! This article aims to guide you on how to use TradingView effectively.
Article Summary
- 📊 TradingView is a charting platform for various financial assets, including crypto assets, with multiple analysis tools and technical indicators.
- ⭐ TradingView has various features, including drawing tools, technical indicator presets, a crypto screener, Pine Script™, and a community that can be used to share trading ideas or strategies.
- 🔎 Traders can use TradingView to find support and resistance points, price trends, and projections and test their trading strategies.
What is TradingView?
TradingView is a charting platform for various financial assets, including crypto assets, with multiple analysis tools and technical indicators. Users can use TradingView to analyze the price and volume of a crypto asset in real-time or based on historical data.
TradingView is also a social network for traders or investors. It is currently a favorite platform for traders with its various features and tools.
TradingView’s tools include drawing tools for drawing lines or analysis curves, a wide range of technical indicators and strategies, a crypto screener, and price alerts. TradingView also has a community that allows users to share trading ideas and strategies.
Learn the importance of technical analysis and how to do it in the following article.
Why Should You Use TradingView?
Whether you’re a beginner or a professional trader, TradingView offers many advantages. Moreover, most of its basic features can be accessed for free. This certainly makes it easier for beginner traders who are starting to learn.
Here are some of the benefits of using TradingView:
- 🔬 Finding entry and exit points. Utilizing the various technical indicators in TradingView, users can analyze and find the right levels to open positions (entry) and exit.
- 👁️ View price trend movements. Chart, line, and technical analysis tools can help traders see the direction of an asset’s price trend. Users can also predict price trends by combining them with technical indicators.
- ⚗️ Testing trading strategies. TradingView allows users with basic coding skills to create and backtest their own indicators. So, users don’t have to worry about the risk of failure when trying out strategies in the real market.
- 🔎 Find trading ideas and strategies. The community feature allows users to find references to trading strategies or set-up methods from other traders. This can also be used as a place of learning for beginner traders.
TradingView Features
- 📊 Interactive Charts. TradingView’s graphic displays, such as candlesticks, bars, lines, and more. Users can easily customize and modify them according to their preferences.
- 🖌️ Drawing Tools. This feature lets users draw lines, curves, or text directly in the price chart area.
- 📈 Indicators and Analysis Tools. TradingView has an extensive library of technical indicators. They range from moving averages, RSI, MACD, and bollinger bands to custom indicators created by the user community.
- 🌐 Social Network. As a social platform, TradingView has a community that allows users to share trading ideas and strategies, analysis, and predictions with other users.
- 💻 Pine Script™. This feature allows users to create and use their own version of strategies or tools. Users can also do backtesting first before applying them in the real market.
The following article can help you identify candlesticks, their patterns and meanings.
How to Use TradingView
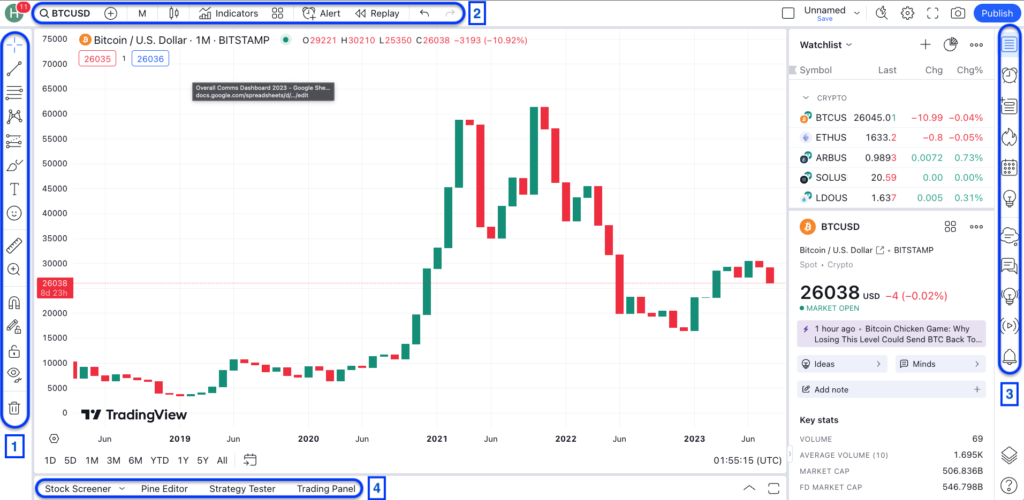
Open the TradingView website, go to the ‘chart’ column, and select the desired crypto asset pairing. For example, if we choose the BTC/USDT pair, it will look like the image above. TradingView will display the chart area along with four supporting toolbars.
- Chart Area
The chart area displays the price chart of BTC/USD in the form of candles over a specific time frame. The candles represent the opening and closing price movements of BTC/USD. You can also draw and analyze using the various tools on the toolbar in this chart area. Use at least three technical indicators to give more accurate results.
- Toolbar 1
This toolbar contains various tools for drawing and creating patterns in the chart area. You can create trend lines and determine support and resistance points. In addition, there are also more advanced tools such as Fibonacci retracement, patterns, and projection of long or short positions.
Toolbar 2
This section contains tools to change the chart’s appearance, such as the price time frame. You can change it to seconds, minutes, daily, weekly, or monthly. It is also possible to change the shape of candlesticks, compare the price movement of one asset with another, and create price alerts. The most important tool is the technical indicator presets. These include moving averages, RSI, MACD, volume, bollinger bands, or other TradingView user-generated custom indicators.
Toolbar 3
This toolbar provides access to a wide range of supporting information for TradingView users. It can display key statistics such as volume, market cap, or views and analysis from other users. You can also create watchlists using this toolbar.
- Toolbar 4
The most important tool in this section is the crypto pair screener. Users can select and display the performance of crypto asset pairs that meet specific criteria. For example, the crypto with the highest volume or based on their SMA trends and oscillators.
In addition to TradingView, the following are four crypto screener sites used by investors.
How to Add Indicators in TradingView
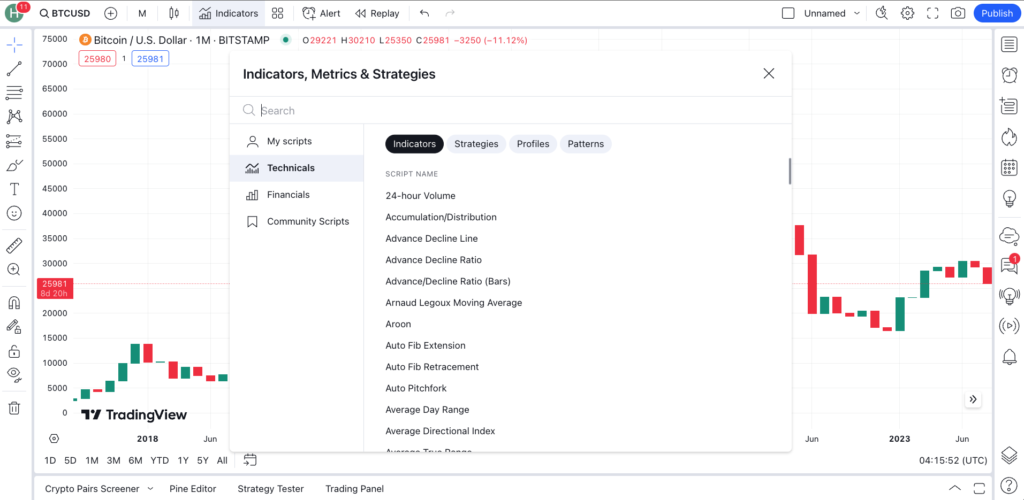
To add technical indicators in the chart area, simply select the ‘indicators’ menu on toolbar 2. After that, a variety of technical indicators will automatically appear that can be used by users. Then choose the type of technical indicator to be used. The indicator will be automatically added to the chart area.
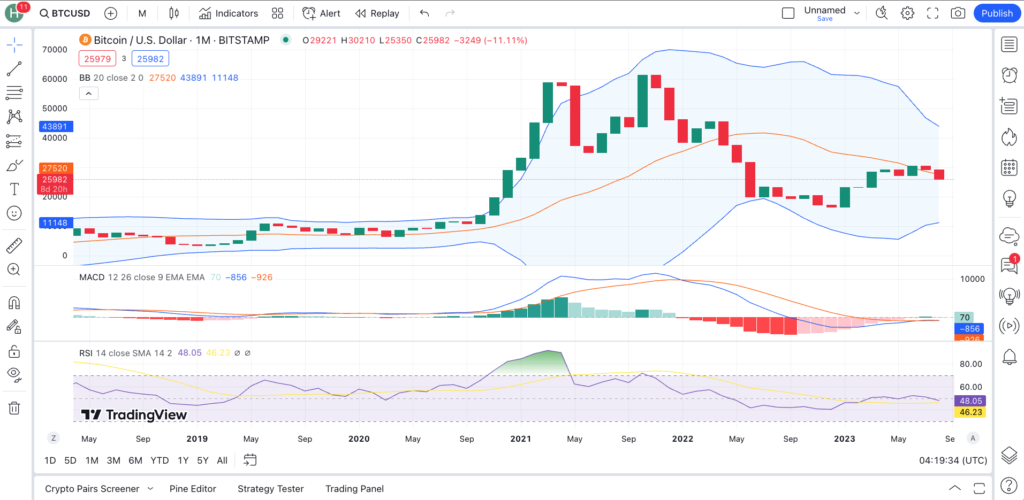
The image above shows the area chart when the MACD, RSI, and bollinger band indicators are added. With these three technical indicators, users can perform more accurate technical analysis. Remember, a free TradingView account can only use three indicators in one chart view.
How to Use Fibonacci Retracement TradingView
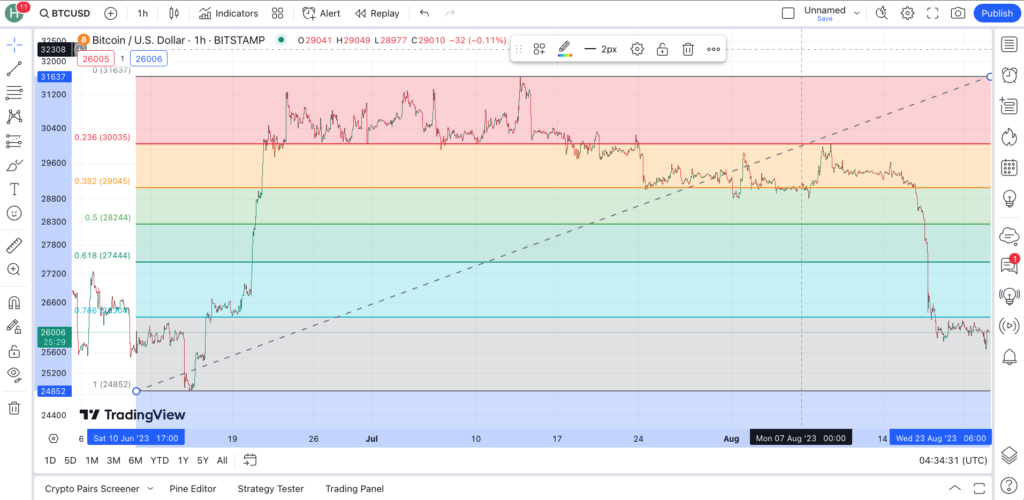
Fibonacci retracement is a helpful indicator for displaying support and resistance levels. Each important price point will be represented by a line separated by Fibonacci numbers in percent (78.6%, 61.8%, 50%, 38.2%, and 23.6%). To use it, users can select the third tool on toolbar 1 and choose the ‘Fib Retracement’ tool.
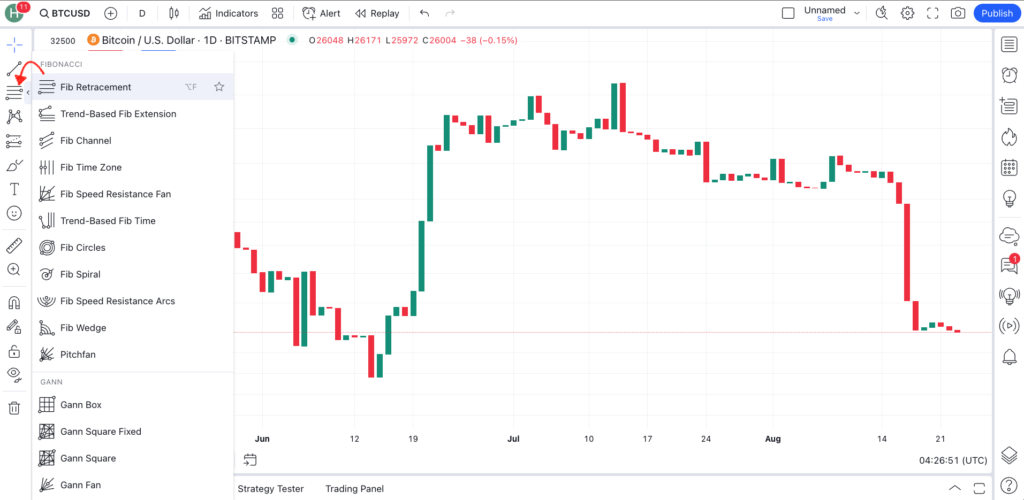
Then, pick the lowest and highest price point on the chart. Draw a dotted line diagonally from the lowest point to the highest according to the desired time range. Fibonacci retracement will appear automatically and display several support and resistance levels with different colors.
If you don't want to create lines manually, you can also use automatic Fibonacci retracement. Select the indicators menu on toolbar 2, then search for the Fib Retracement indicator. Then, choose the 'Auto Fib Retracement' indicator. The Fibonacci retracement line will appear automatically.
Pros and Cons of TradingView
TradingView is a complete technical analysis platform that meets the needs of its users. From analytical tools and technical indicators to additional features such as education and a place to test strategies. TradingView is also easy for beginner traders since the basic features are free.
The community feature can also help users with various references and insights related to market conditions and trading strategies. However, TradingView does not have a content curation system. This makes the quality of the content either very bad or excellent. The absence of a curation system also can be used by irresponsible parties to share insights with the intention of FOMO, FUD, or pump and dump.
Pintu Academy has prepared an article that deep dives into crypto scams and how to avoid them here.
Conclusion
TradingView is an essential tool for any crypto trader or investor. Even if you’re new to investing, TradingView offers free access and covers many of the basics. For seasoned trader, there are paid packages that provide all the features you’ll need. Through TradingView, investors can conduct both fundamental and technical analyses, leading to a more comprehensive understanding of the market.
Buy Crypto Assets in Pintu
After knowing how to use TradingView, you can try to do a technical analysis first before buying crypto assets in Pintu. You can safely and conveniently purchase a wide range of cryptocurrencies such as BTC, ETH, SOL, and others safely and easily at Pintu. Pintu diligently evaluates all its crypto assets, highlighting the significance of being cautious.
Pintu is also compatible with popular wallets such as Metamask to facilitate your transactions. Download Pintu app on Play Store and App Store! Your security is guaranteed because Pintu is regulated and supervised by Bappebti and Kominfo.
Aside from buying and trading crypto assets, you can expand your knowledge about cryptocurrencies through various Pintu Academy articles. Updated weekly, all Pintu Academy articles are made for knowledge and educational purposes, not as financial advice.
Reference
- Carlos Vilhena, TradingView Review 2023: Is It the Best Stock Charting Tool? Finmaster, accessed on 22 August 2023.
- Wunder Trading, Complete TradingView Tutorial: How to Use TradingView for Crypto? accessed on 22 August 2023.
- Cory Mitchell, What Are Fibonacci Retracement Levels, and What Do They Tell You? Investopedia, accessed on 23 August 2023.